Salesforce is a highly customizable and widely used CRM platform that uses observability to maintain and troubleshoot its applications. Observability in Salesforce primarily involves monitoring logs, setting up alerts, and tracking performance metrics.
The problem is that we need more of the right insights, and the leading cause of this is the app's inflexibility. This is nothing new, but how do we fix the problem?
Using an open source, flexible, and extensible tool like Parseable, along with Factorwise for Salesforce integration - you can improve observability in your Salesforce application for optimal health and performance, helping you serve customers and generate revenue. Let's see how.
Top 4 limitations for Observability in Salesforce
Salesforce offers built-in debugging tools like debug logs dump for tracking events. These are written in Apex, or low-code features like flow. However, this has significant limitations:
- Real-time parsing challenges: Debug logs are not designed for reading in real-time, making it difficult for developers to identify and resolve issues quickly.
- Developer console limitations: While the Developer Console can search through logs, it is not user-friendly and can be unstable, especially with large log files. Its session-based nature can lead to frequent crashes.
- Performance impact: Enabling Debug logs in production environments can degrade performance, creating a trade-off between observability and system efficiency.
- Low-level detail overload: Debug logs often contain low-level details that may not be relevant to developers, who typically look for application-level logs such as System.debug calls.
How we've previously addressed these challenges
Third-party services
Several third-party services have tried to address Salesforce's observability challenges in the past. However, these solutions are often not viable for all Salesforce operations teams, particularly those in medium and small businesses, due to cost constraints. As a result, many teams continue to rely on the built-in debug logs despite their limitations.
Another constraint they encounter is the need for user-friendly interfaces for log visualization and searching.
Some organizations develop custom logging solutions to overcome these challenges, but they often involve storing logs within the Salesforce instance and publishing them on the Event Bus. An example of this is NebulaLogger. While effective to some extent, without a helpful user interface for log visualization and search capabilities, insights cannot be understood, evaluated, and acted upon in a way that improves observability in Salesforce. Additionally, Salesforce's native search on large text areas can be slow, hampering efficiency.
How we address Observability in Salesforce today with Parseable & Factorwise
Parseable is an open-source log analytics tool that simplifies and enables bold insights for teams looking for a competitive edge.
Intuitive dashboard for log management
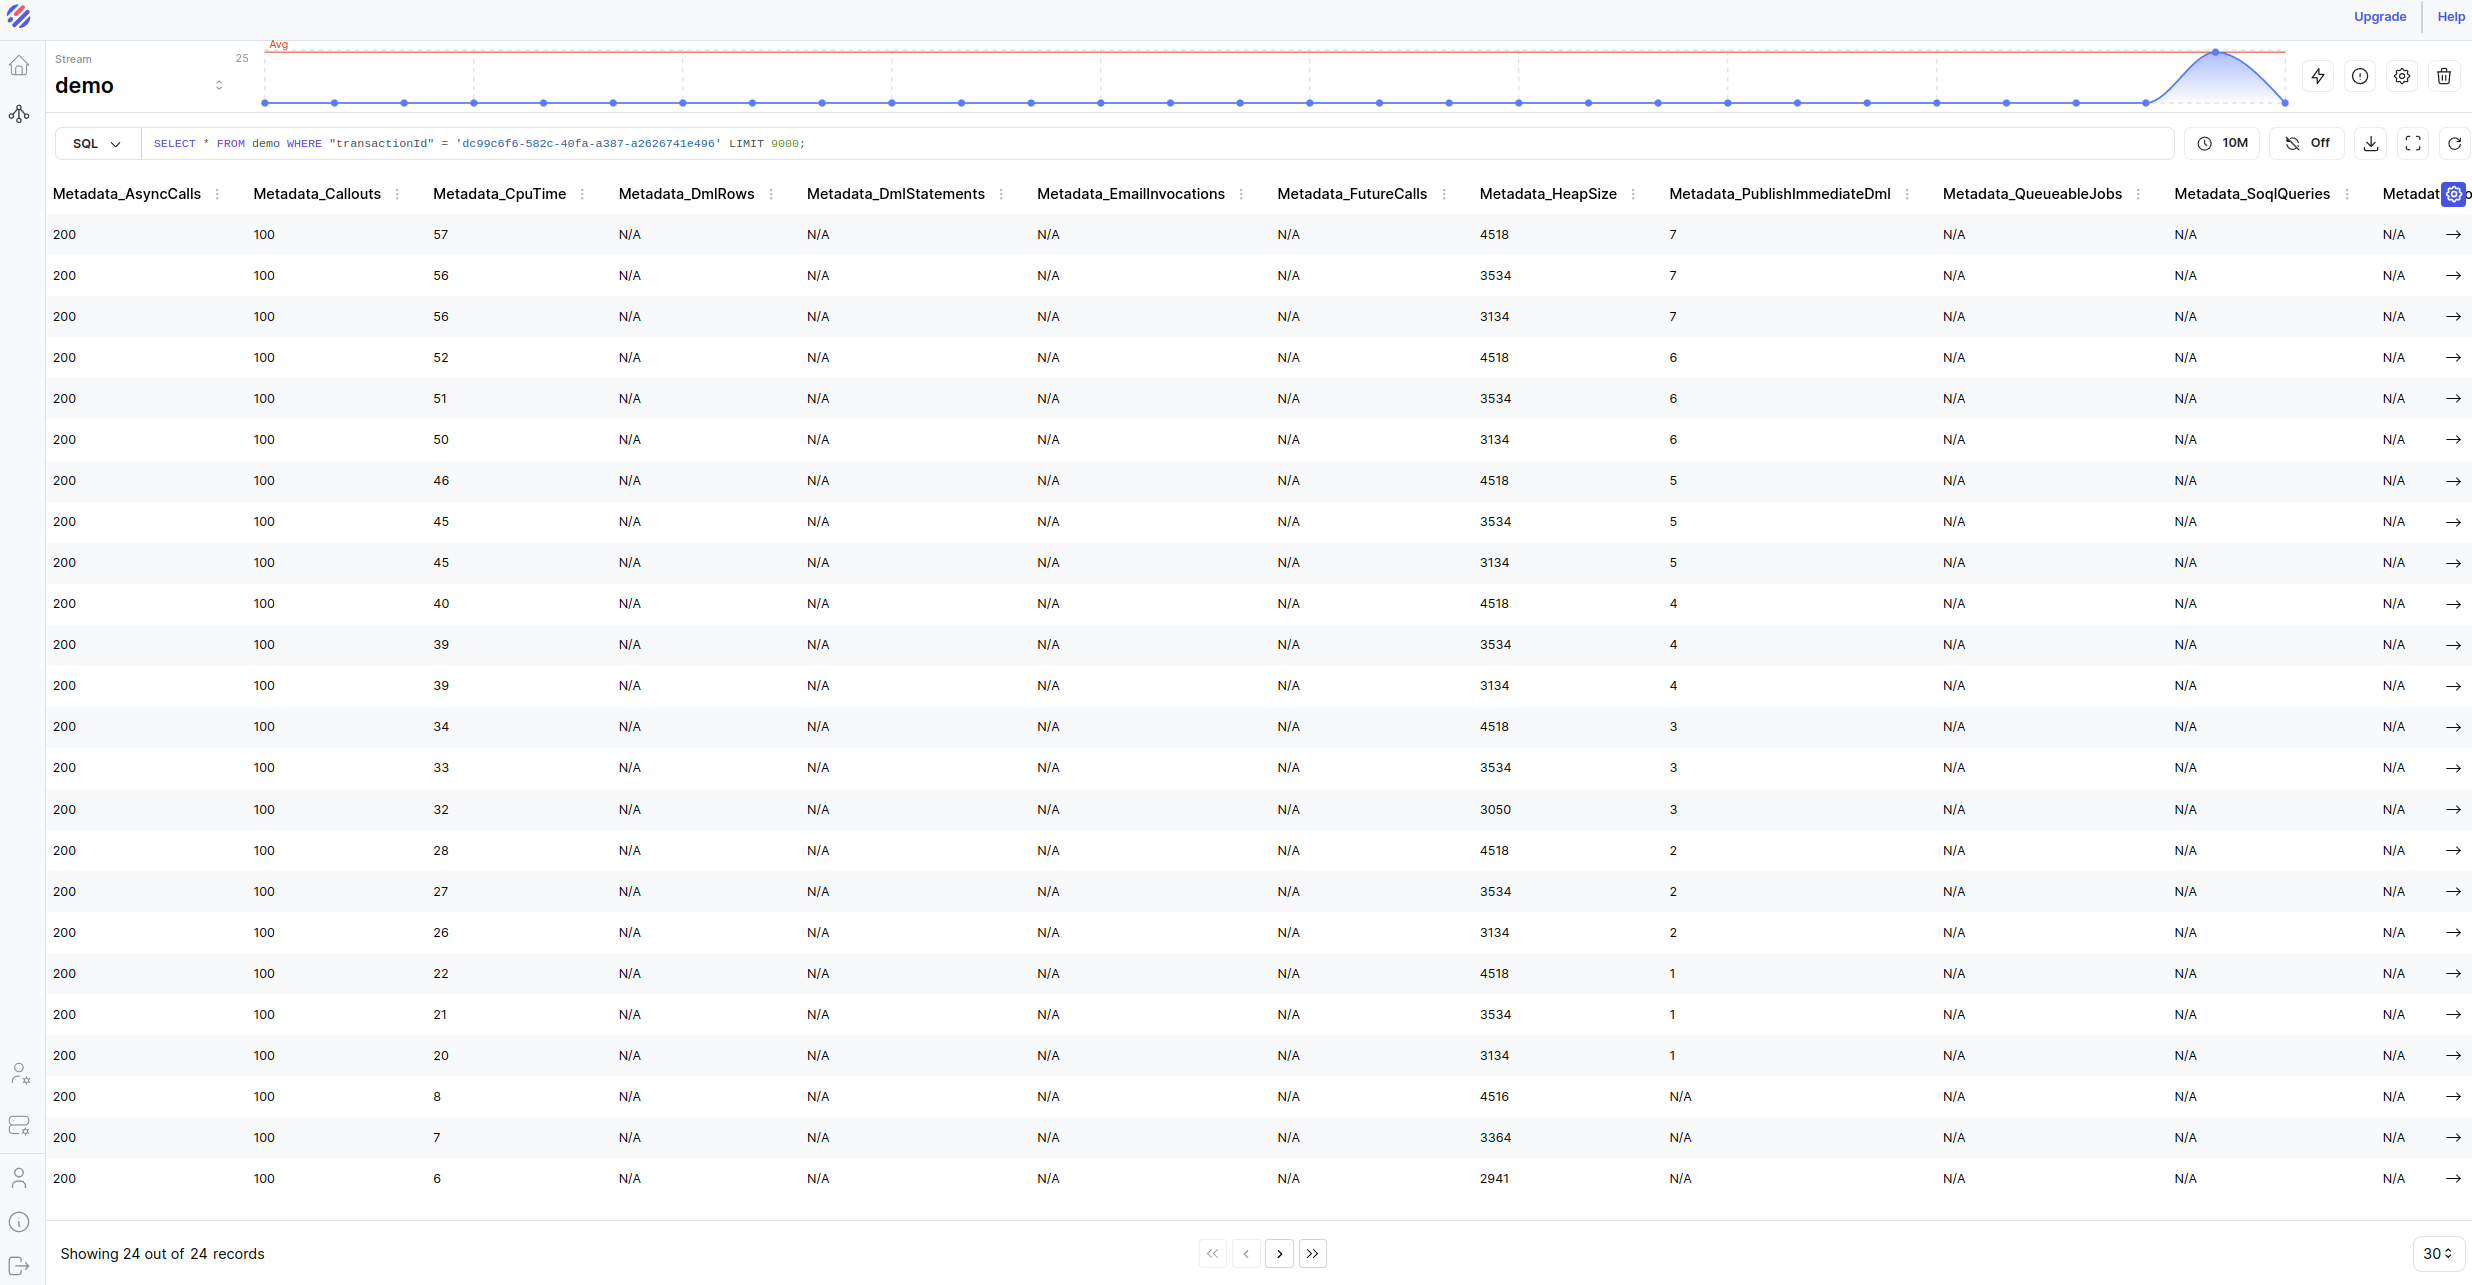
Parseable's intuitive UI and familiar SQL syntax make it simple yet powerful for developers to query logs.
Factorwise Logger, generates unique transaction IDs for every invocation of custom Salesforce logic, simplifying the process of tracking and debugging specific transactions.
With Parseable, Salesforce logs can be parsed and searched in real time, enabling rapid identification and resolution of issues. This capability is a significant improvement over the traditional Salesforce Developer Console, providing a more stable and user-friendly interface for log management.

The right alert for the right team at the right time
Parseable enables real-time alerts based on defined conditions, ensuring that abnormal events are promptly identified and addressed. Notifications are delivered to the right team via Slack, Alertmanager, or custom webhooks, keeping the team or person you choose informed and able to respond sooner rather than later to potential issues.
Factorwise Logger captures Salesforce governor limits on every log event generated, storing this data in Parseable. This feature enables teams to track performance bottlenecks and optimize their applications effectively.

Visualize metrics that matter to your team
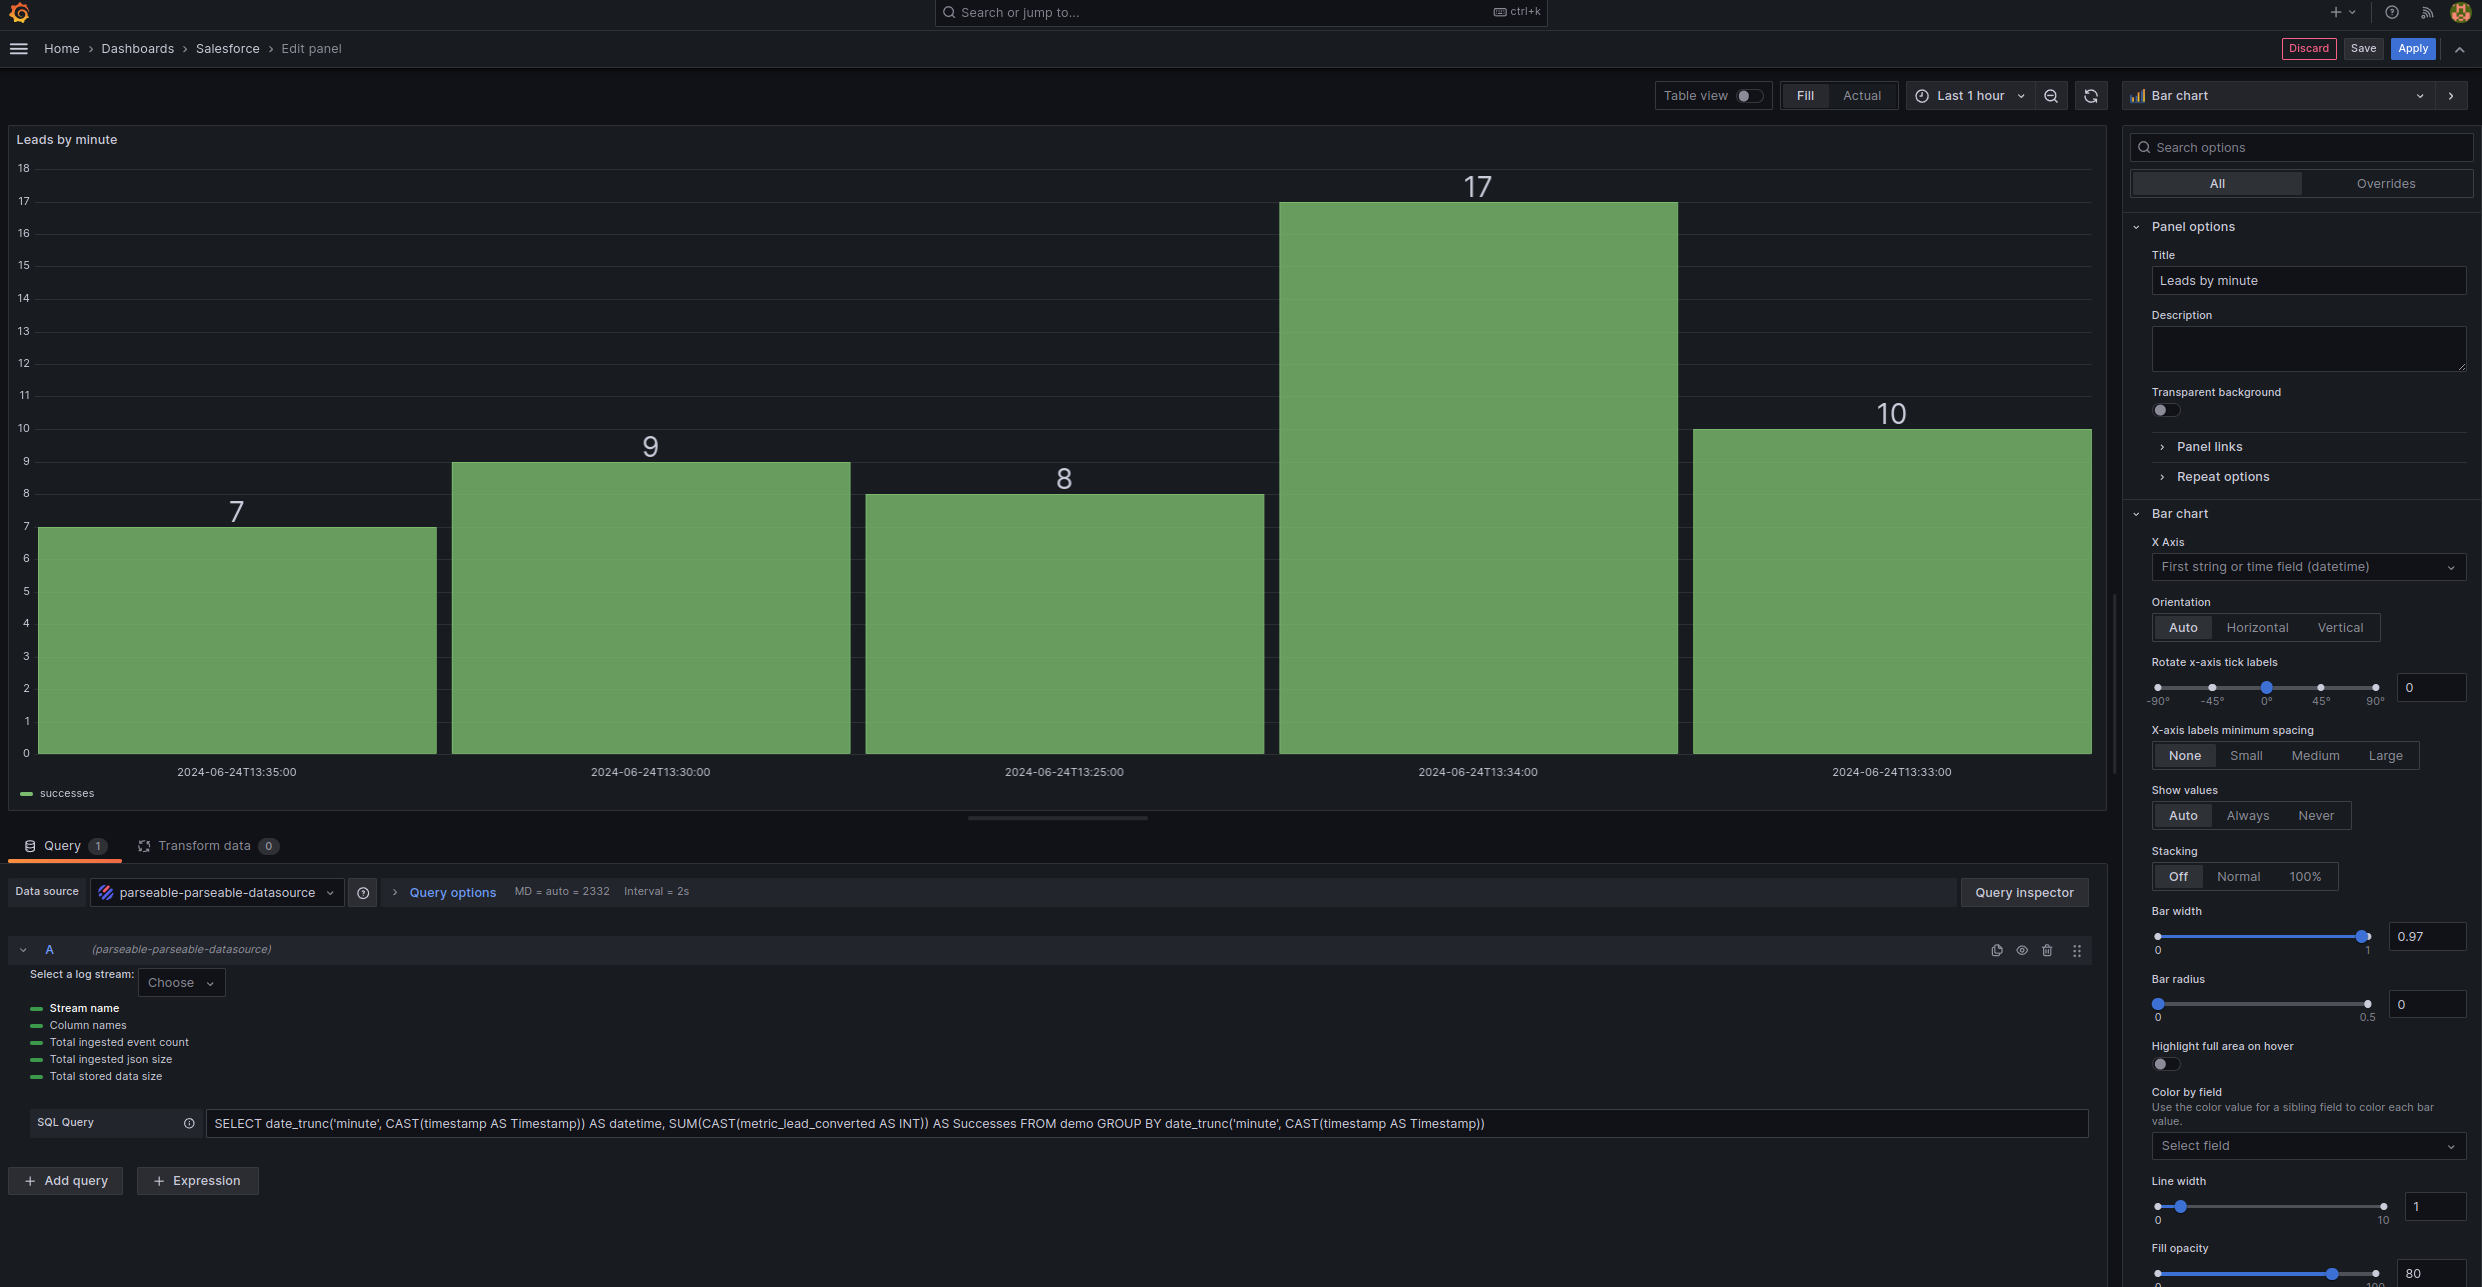
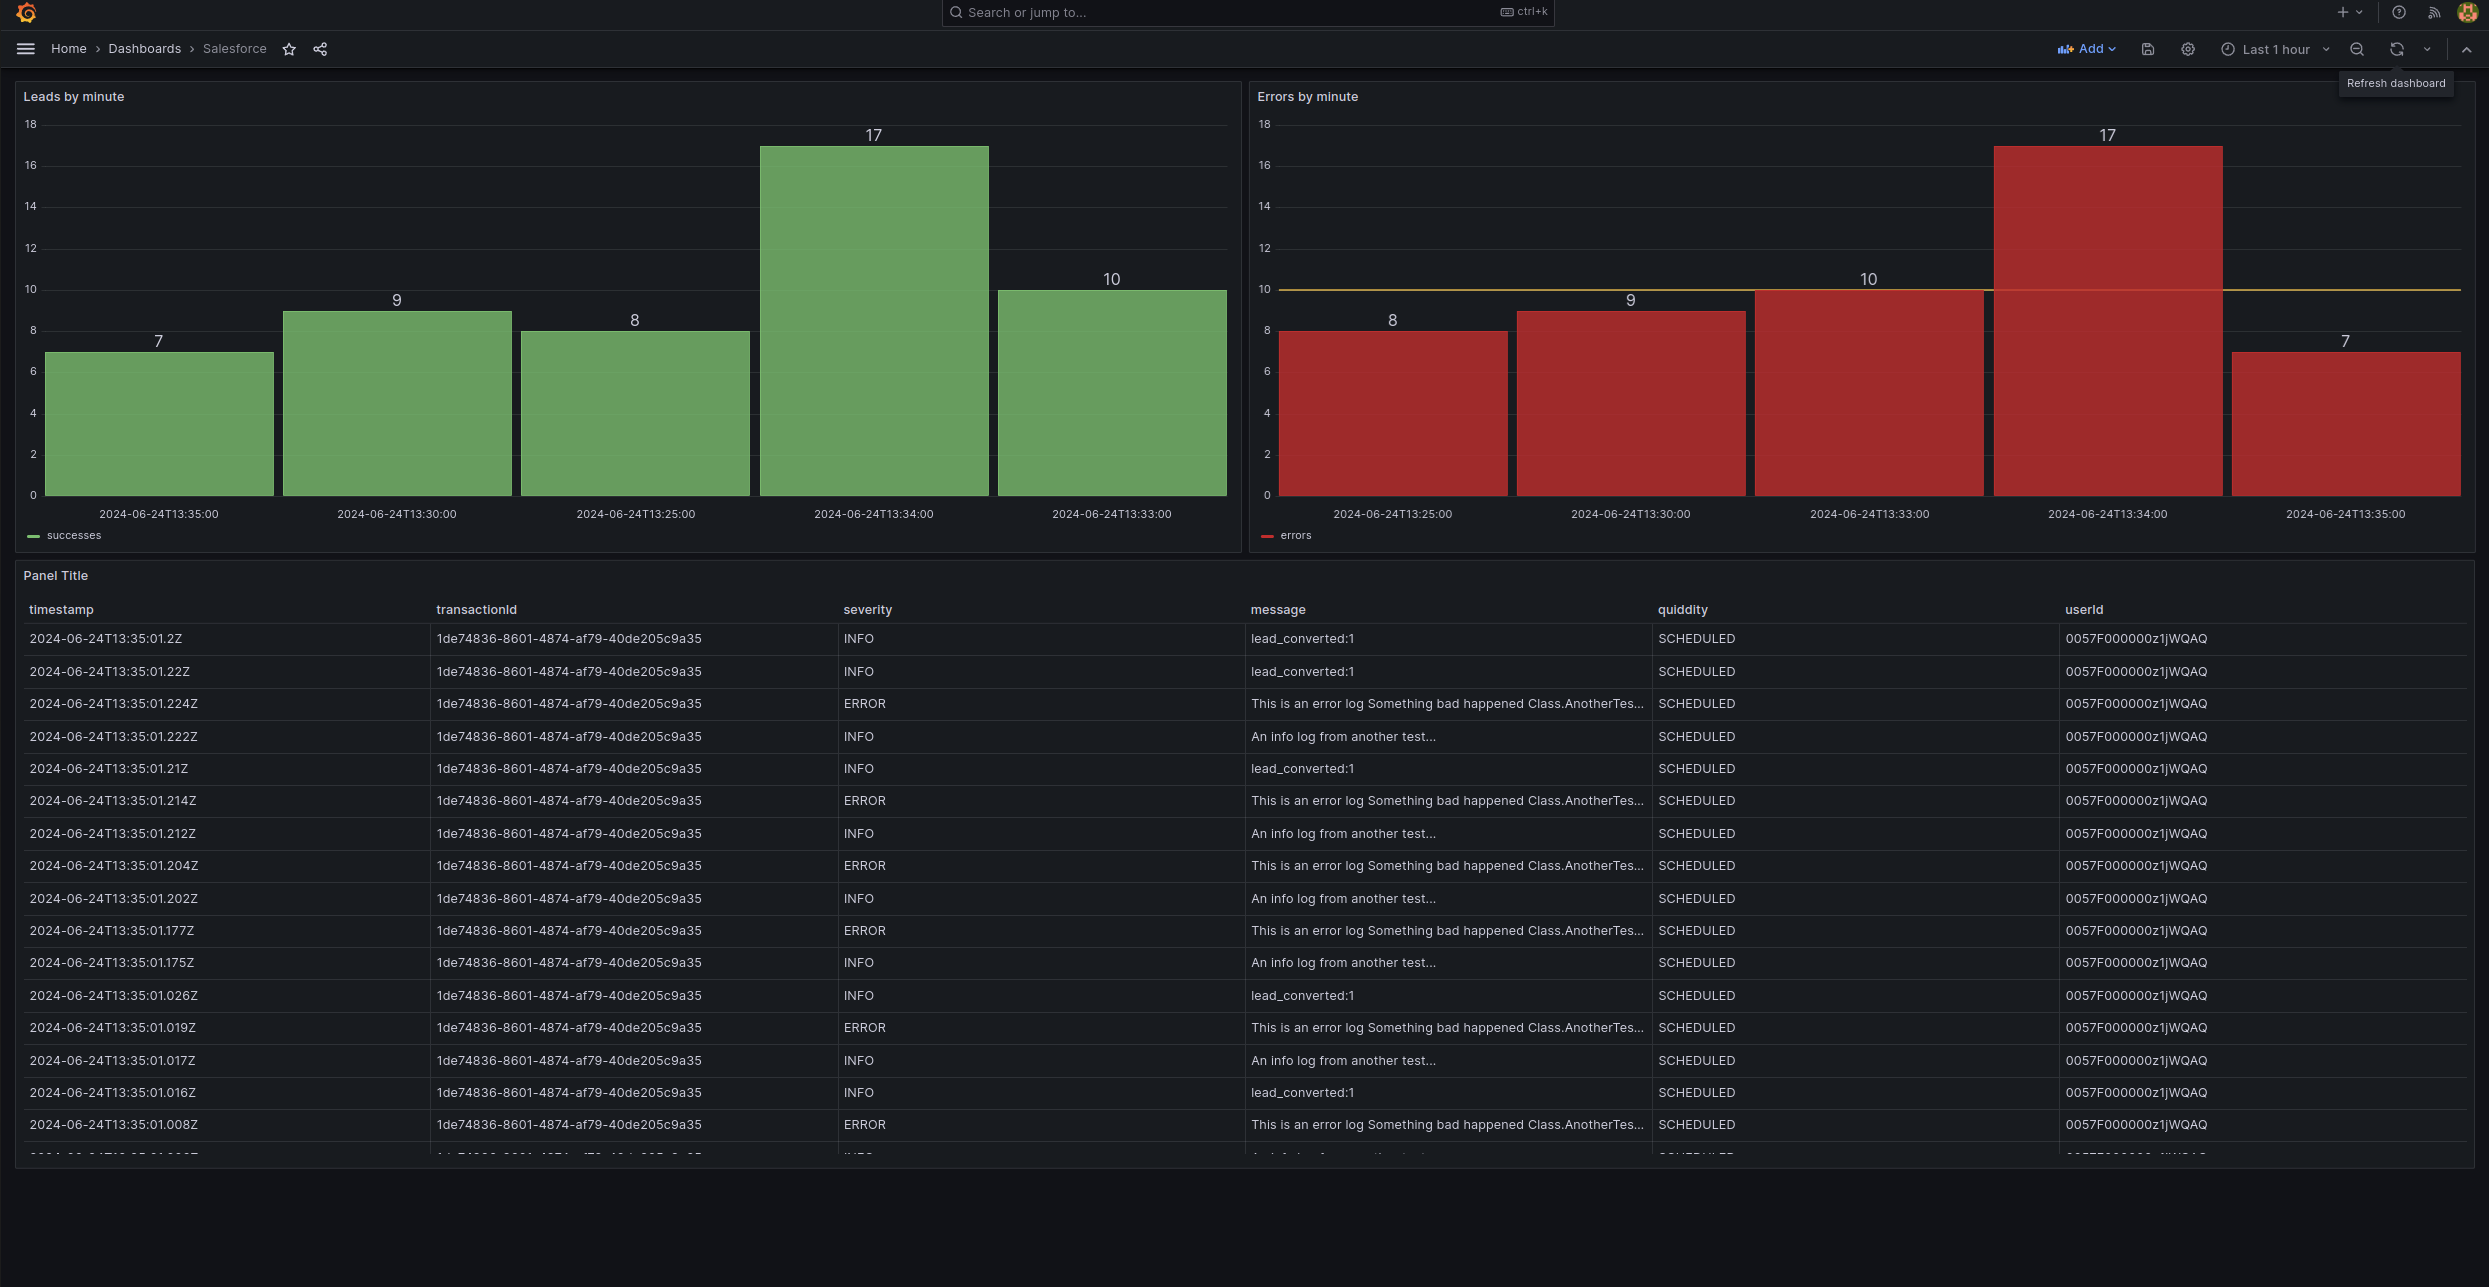
Parseable also supports the aggregation and visualization of business and operational metrics!

For example, teams can track the number of leads converted over various time intervals, gaining insights that are difficult to obtain using native Salesforce reports. Parseable's fast query results make real-time data analysis straightforward and efficient.
For Grafana fans and users, Parseable integrates seamlessly with this popular platform for monitoring and observability to create real-time dashboards that provide a comprehensive view of system performance and business KPIs, enabling data-driven decision-making.

Parseable x Factorwise is ideal for Salesforce log analytics
Factorwise is building a Salesforce native logger, that integrates very well with Parseable. This logger is built with detailed insights from 100s of Salesforce users. Meanwhile, Parseable stands out as the optimal choice for Salesforce observability for several reasons:
- Ease of use: Parseable is easy to deploy, operate, and scale, making it accessible for organizations of all sizes. Its intuitive UI and SQL-based query language reduce the learning curve and enable rapid adoption.
- Comprehensive features: Parseable offers a range of built-in features, including real-time log parsing, alerts, RBAC (Role-Based Access Control), and soft-multi tenancy through stream-based segregation. These capabilities ensure that teams have everything they need to maintain robust observability.
- Cost-effectiveness: For medium and small businesses, Parseable provides a cost-effective solution that doesn't require extensive resources to manage. This makes it an attractive alternative to more expensive third-party services.

If you'd like to talk about how Parseable x Factorwise can help your Salesforce team, please schedule a demo.
We'd love for you to try Parseable today! Ask questions and tell us what you think by joining our community in Slack.


