18 posts tagged with "Integrations"

Read about Parseable and its integrations with other data, visualization and management products from the ecosystem.

View All Tags

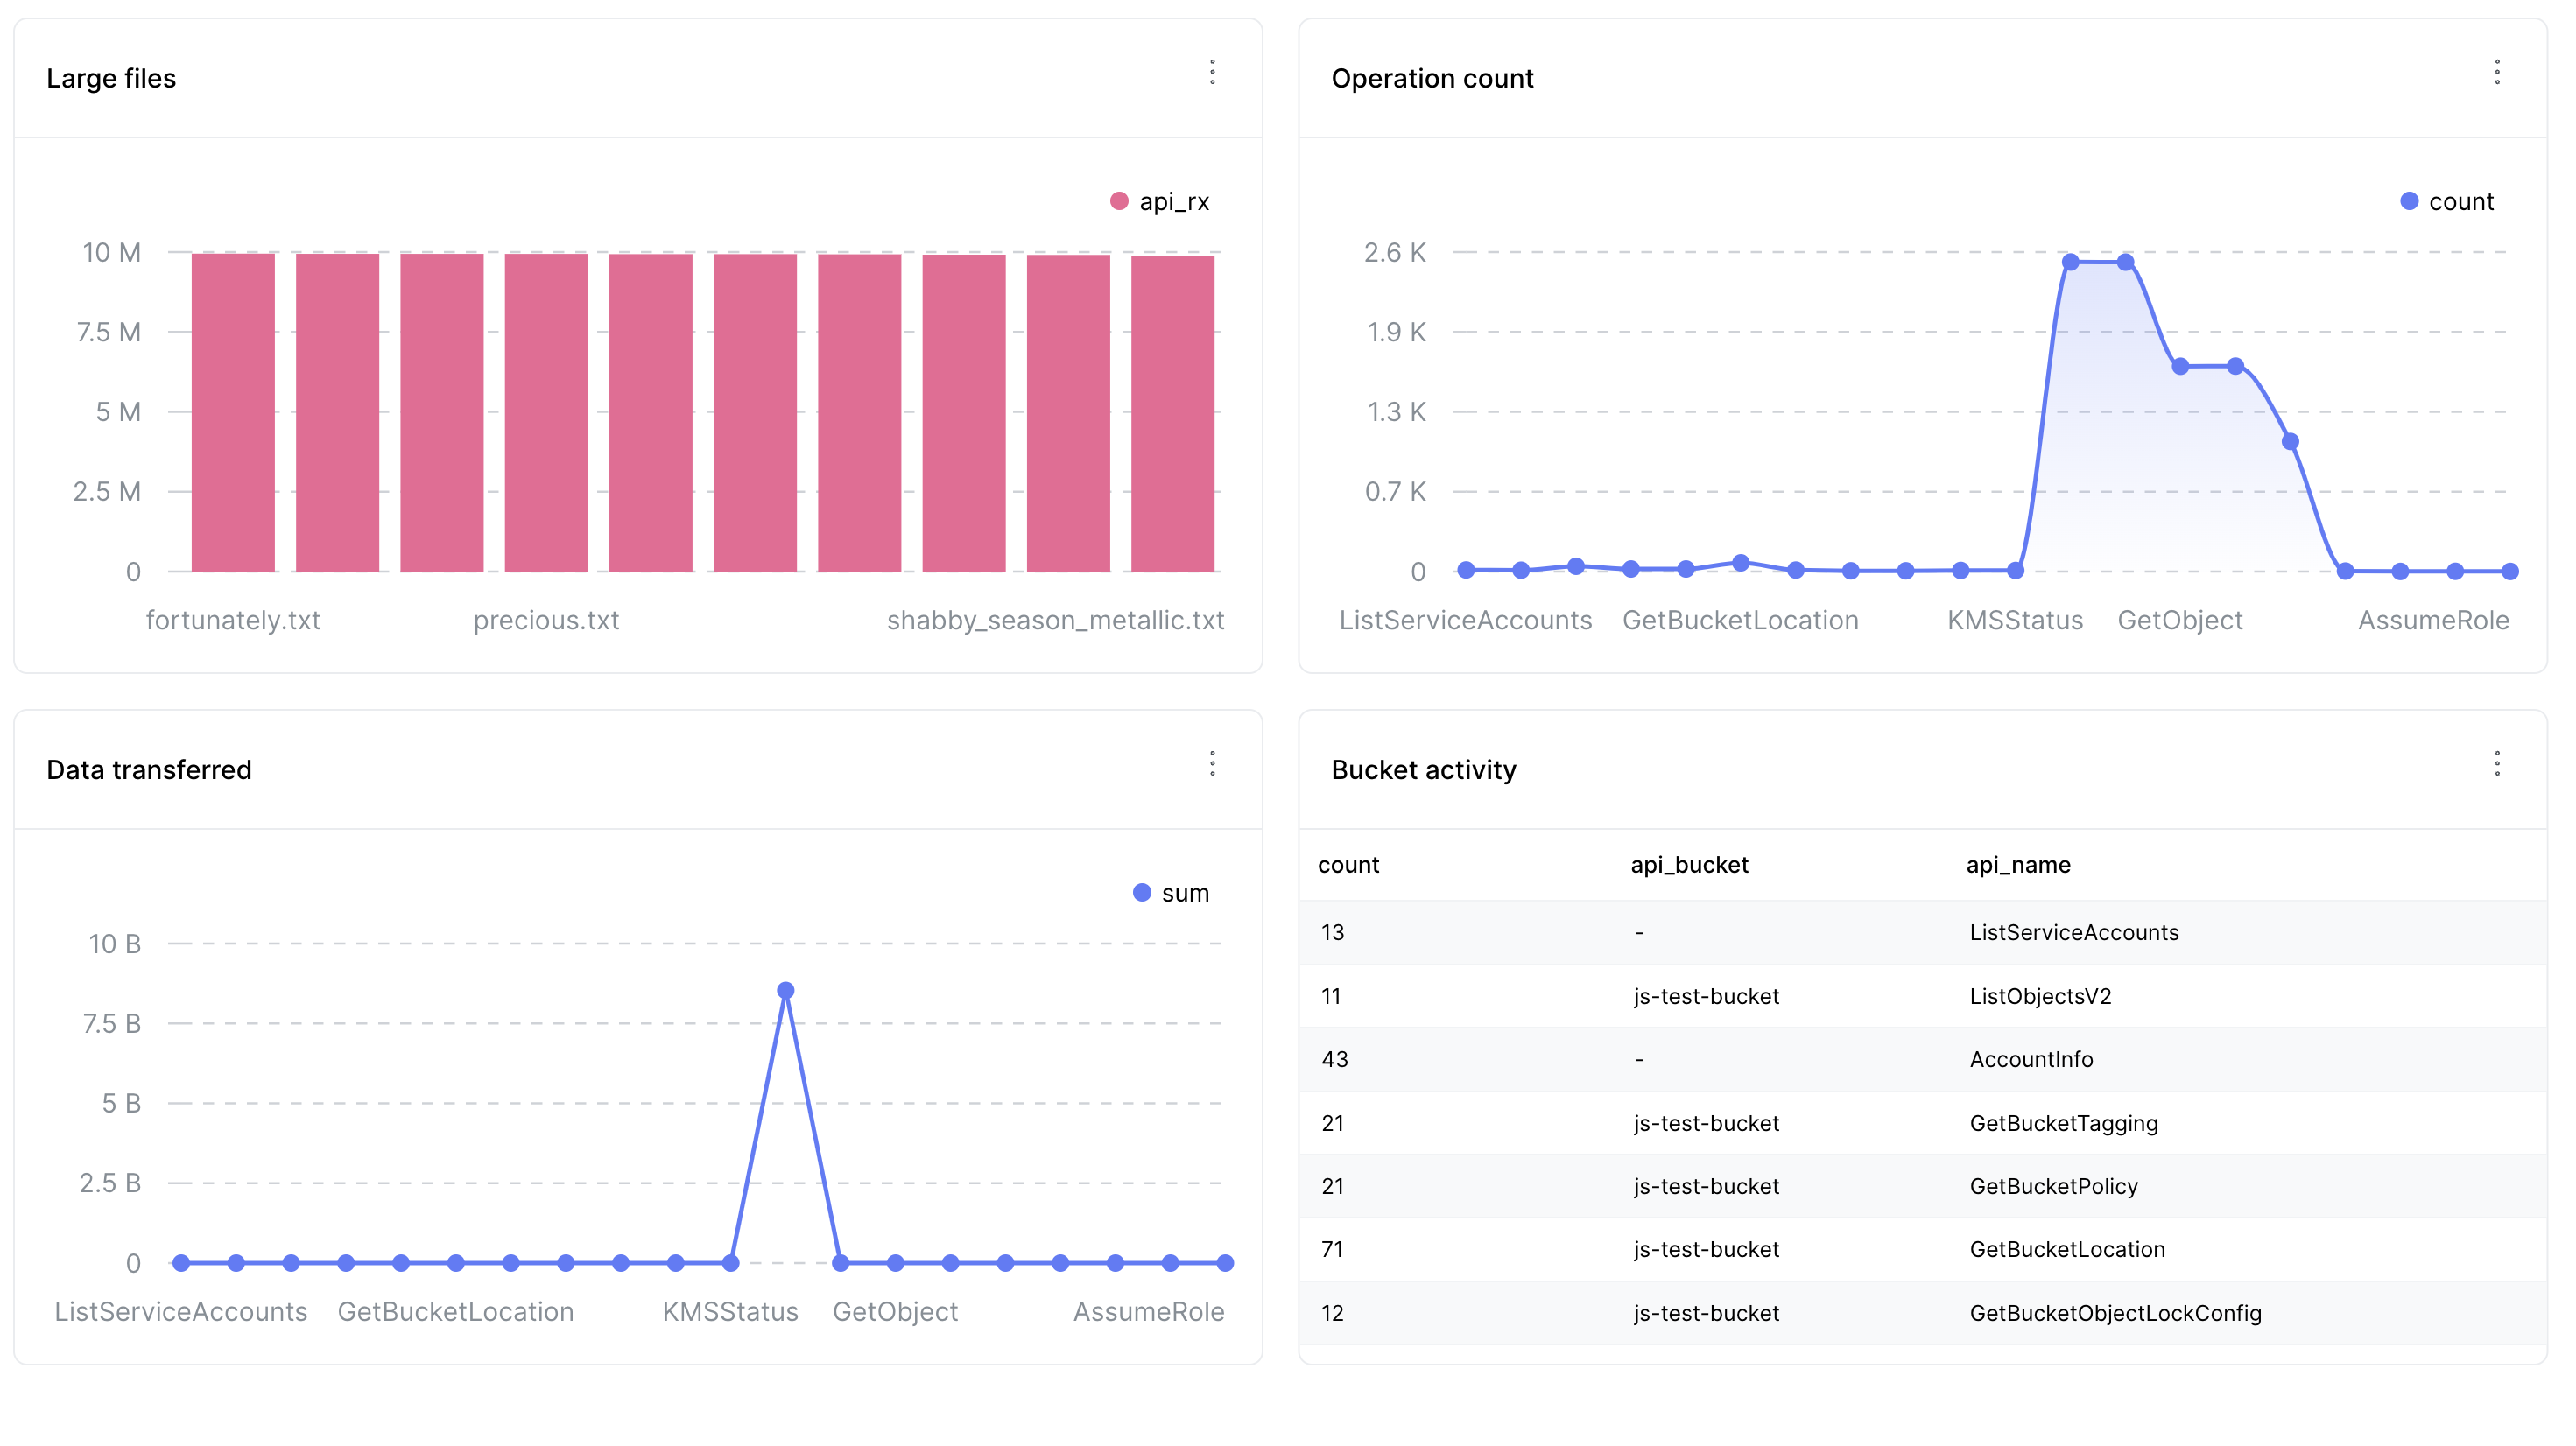
Parseable as logging target for MinIO Audit & Debug logs

· 7 min read
Chris Ward
Guest Author

As new architecture patterns like separation of compute and storage evolve, object storage is increasingly the first choice for applications to store primary (non-archival) data. This is in addition to the old use cases of archival and large blob storage.
dashboards

MinIO is an open-source, AWS S3-compatible object storage platform, allowing developers to use one of the most common object-based storage options without vendor lock-in and with flexibility.

Five Drawbacks of CloudWatch - How to Switch to Parseable

· 5 min read
Shivam Soni
Guest Author

AWS CloudWatch is a popular choice for log management and monitoring particularly for those deeply integrated into the AWS ecosystem. However despite its widespread use several drawbacks make it less appealing for specific applications especially those requiring flexibility cost-efficiency and high customizability.

In this article we'll consider when to use AWS CloudWatch versus Parseable and explain how to make the switch to Parseable.

How to monitor your Parseable metadata in a Grafana dashbaord

· 5 min read

As Parseable deployments in the wild are handling larger and larger volumes of logs, we needed a way to enable users to monitor their Parseable instances.

Typically this would mean setting up Prometheus to capture Parseable ingest and query node metrics and visualize those metrics on a Grafana dashboard. We added Prometheus metrics support in Parseable to enable this use case.

But we wanted a simpler, self-contained approach that allows users to monitor their Parseable instances without needing to set up Prometheus.

This led us to figuring out a way to store Parseable server's internal metrics in a special log stream called pmeta. This stream keeps track of important information about all of the ingestors in the cluster. This includes information like the URL of the ingestor, Commit id of that ingestor, number of events processed by the ingestor, and staging file location and size.

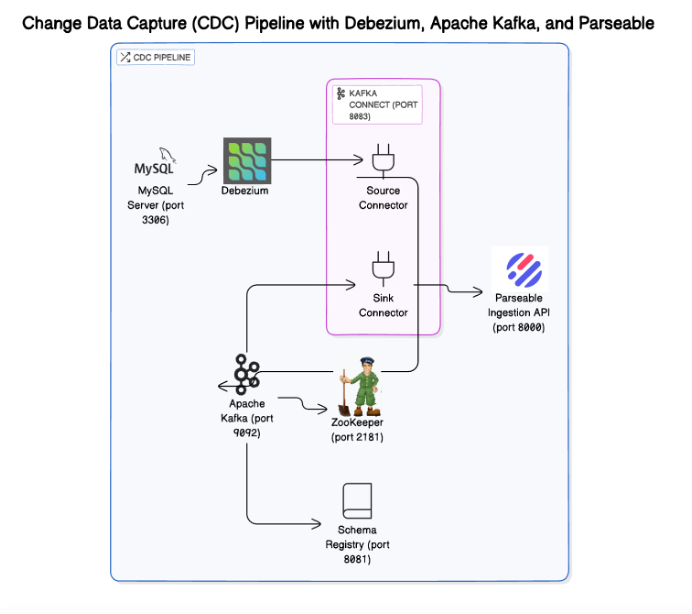
How to set up a CDC pipeline to capture and analyze real-time database changes with Parseable

· 7 min read

Databases are critical for any application. Data constantly gets updated, inserted, and deleted. In most of cases it is important for the business to keep track of these changes due to security concerns, auditing requirements, and to keep other relevant systems up to date.

Change Data Capture (CDC) has gained popularity, precisely to address this problem. CDC is a technique used to track all changes in a database and capture them in destination systems. Debezium is a popular CDC tool that leverages database logs as the source of truth, and streams the changes to Kafka and compatible systems like Redpanda.

Load testing Parseable with K6

· 6 min read

Integrating K6 with Kubernetes allows developers to run load tests in a scalable and distributed manner. By deploying K6 in a Kubernetes cluster, you can use Kubernetes orchestration capabilities to manage and distribute the load testing across multiple nodes. This setup ensures you can simulate real-world traffic and usage patterns more accurately, providing deeper insights into your application's performance under stress.

Build a robust logging system with Temporal and Parseable

· 6 min read

Temporal is a leading workflow orchestration platform. Temporal offers a robust, durable execution platform that offers guarantees on workflow execution, state management, and error handling.

One of the key aspect for a production grade application is the ability to reliably log and monitor the workflow execution. The log and event data can be used for debugging, auditing, custom behavior analysis, and more. Temporal applications are no different. Temporal provides logging capabilities, but it can be challenging to manage and analyze logs at scale.

In this post, we'll see how to extend the default Temporal logging to ship logs to a Parseable instance. By integrating Parseable with Temporal you can:

  • Ingest workflows logs to create a centralized data repository.
  • Co-relate events, errors, and activities across your workflows.
  • Analyze and query logs in Parseable for debugging and monitoring.
  • Setup reliable audit trails for your workflows using Parseable.
  • Setup alerts and notifications in Parseable for critical events in your workflows.

and much more.

Behavioral data analytics with Parseable and Grafana

· 9 min read
Abhishek Sinha
Guest Author

Behavioral data analysis examines detailed user activity logs to understand customer behavior on a website. Companies that utilize this tactic have a competitive advantage in their industry.

This article will explore how to analyze clickstream data generated from an eCommerce portal and use it to understand user preferences visitor traffic session information and more by building a report and dashboard using Parseable and Grafana.

Ingesting Data to Parseable Using Pandas, A Step-by-Step Guide

· 4 min read

Managing and deriving insights from vast amounts of historical data is not just a challenge but a necessity. Imagine your team grappling with numerous log files, trying to pinpoint issues. But, because logs are stored as files, it is very inefficient to search through them. This scenario is all too familiar for many developers.

Enter Parseable, a powerful solution to analyze your application logs. By integrating with pandas, the renowned Python library for data analysis, Parseable offers a seamless way to ingest and leverage historical data without the need to discard valuable logs.

In this blog post, we explore how Parseable can revolutionize your data management strategy, enabling you to unlock actionable insights from both current and archived log data effortlessly.

Get Updates from Parseable

Subscribe to keep up with latest news, updates and new features on Parseable