Behavioral data analysis examines detailed user activity logs to understand customer behavior on a website. Companies that utilize this tactic have a competitive advantage in their industry.
This article will explore how to analyze clickstream data generated from an eCommerce portal and use it to understand user preferences visitor traffic session information and more by building a report and dashboard using Parseable and Grafana.
Before we execute the analytics let's compare traditional and modern data architectures to better understand the contemporary approach to data management.
First consider the three main components of a data analysis infrastructure: ingestion storage and the reporting engine. We'll examine each of these components individually and evaluate the technology and architecture of a contemporary analytics stack before making a choice.
Ingestion
The ingestor in a data analytics stack is responsible for collecting and importing data from various sources into a central datastore. In older-generation setups developers selected separate tools to process stream and batch data. Real-time data was pushed to the realtime analytics database for low-latency ingestion and time-sensitive reporting. At the same time all raw events were stored in the data warehouse for batch processing and reporting. This resulted in separate data pipelines and data infrastructure for real-time and batch processing.
Real-time data processing tools were high-performance but also complex and expensive necessitating significant trade-offs. However modern computing architecture parallelism and database stacks have simplified the data pipeline boosting performance and productivity. Now there is no need to take a siloed approach for processing real-time time-spaced and batch data. You can ingest data in near real-time store it in object storage like any data warehouse and still query it with sub-second to second response times for real-time data.
All with simplicity. This unified system supports both use cases without the complexity and high costs.
Storage
Data analytics usually deal with growing data volumes various data types and schema changes within the datastore itself. Having a data infrastructure that can handle both structured and unstructured data provides flexibility and the capability to utilize a wide variety of data.
A system that supports dynamic schema adapts to your incoming data which also helps you unify data from different sources without conflict. Moreover a system that stores data in open data formats and integrates with machine learning and AI tools prepares you for advanced use cases in the future.
Reporting analytics and visualization
Whether the system supports running periodic queries or time-sensitive real-time reporting recent and long-term data are needed. With a modern tech stack you should be able to do both without much complication. Big data analytics is simpler and more powerful than ever. Learn how to leverage it.
Parseable for event stream analytics
Parseable is a fully integrated resource-efficient unified observability platform. Written in Rust the Parsenable team has been intentional about our design decisions at every point to ensure high throughput and low data ingestion latency: a single binary that you can install on a bare metal server or with Docker or Kubernetes.
Parseable scales to store data in the cloud and offers low latency query results. It's the perfect solution for event stream analytics use cases such as clickstream data analytics.
Read more: Setting up clickstream analytics in the react app with Parseable (link) and Build clickstream data infrastructure with Winston and Parseable (link).
To get started you'll need to have Parseable installed and running. Refer to the documentation (link) to install Parseable.
Next let's learn how to query stored data.
Access data and extract insights from Parseable
With Parseable you get an integrated web interface CLI interface and APIs to access ingested data immediately. All the data you send to Parseable becomes accessible for viewing querying and building metrics in almost real-time—within seconds. Additionally there are native plugins such as the Parseable datasource plugin for Grafana which allow you to connect and access Parseable data directly within your Grafana instance.
To install it you are guided by an integrated web UI. From there you can select a stream (similar to tables in DB) and view the data in a formatted table. You can apply filters to the column from the table itself and quickly access filtered data similar to how you would use a spreadsheet.
Filters
For cases where you need compound filters i.e. with more than one condition on more than one field Parseable ensures you can do this without writing any code.
Use the filter form at the top of the table choose the column name from the dropdown enter your conditional value in a text field and select the conditions. Submit and you will get the data you need. No coding is required.
For advanced use cases technical users can use the SQL query builder to write their own queries. Parseable offers a PostgreSQL-compatible SQL query interface. Here you can run basic yet powerful SELECT queries and regex queries and apply advanced SQL features like aggregate functions window functions and scalar functions. This allows you to fetch data through the table query builder or by running your own SQL query. There is no need to learn a custom language.
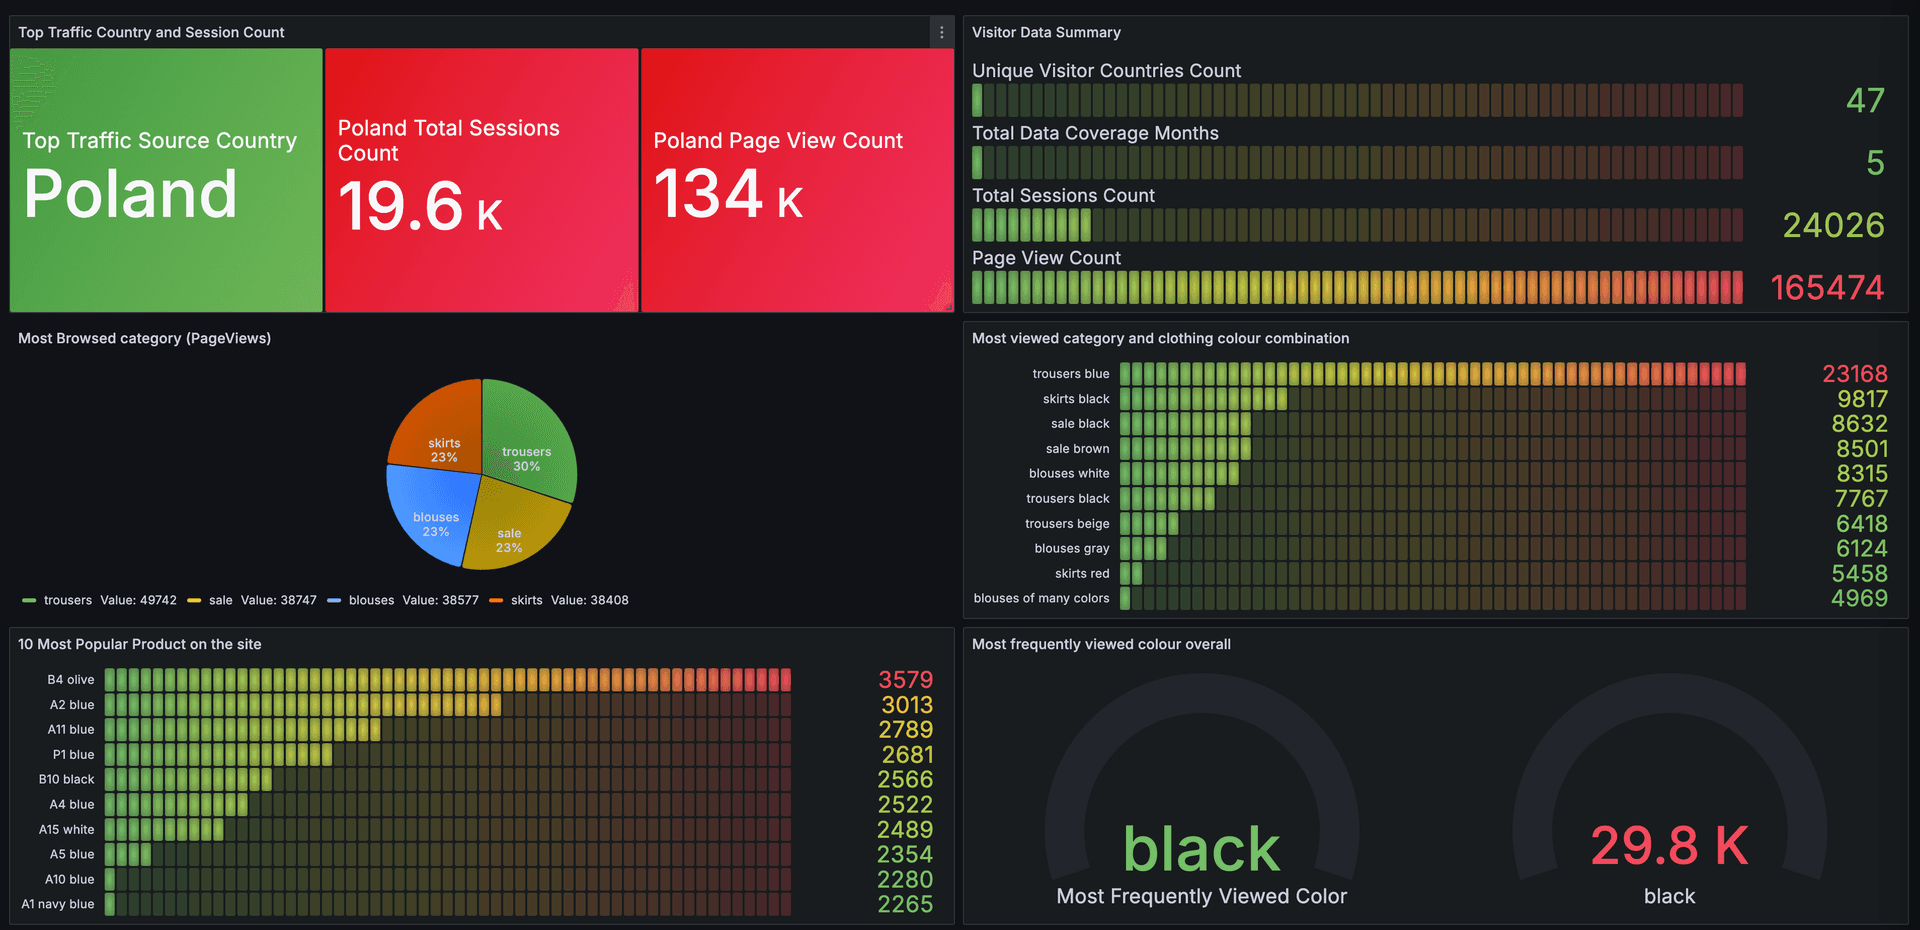
Analytics in action
Let's use an existing eCommerce dataset from Kaggle and perform behavioral analytics. The dataset has about 165000 rows of data and 14 columns. The eCommerce store data spans five months with visitors from 45 countries. It includes four categories 217 products and nine colors.
We will run our queries to analyze page views and traffic data to understand customer preferences.
Parseable offers a PostgreSQL-compatible SQL query interface to query log data. From the eCommerce dataset we will write three standard metrics:
- Identify the country driving most of the traffic and the corresponding number of sessions and page views.
- Identify the most popular product on the website and the corresponding number of page views.
- Session distribution by month
Identify the country driving most of the traffic and the corresponding number of sessions and page views.
SELECT
    CASE WHEN `country` = 29 THEN 'Poland' ELSE 'Unknown' END AS 'Top Traffic Source Country',
    COUNT(DISTINCT `session ID`) AS 'Total Sessions Count',
    COUNT(order) AS 'Page View Count'
FROM
    testclickstream
GROUP BY
    country
ORDER BY
    'Total Sessions Count' DESC
LIMIT 1;
Identify the most popular product on the website and the corresponding number of page views.
SELECT
    "page 2 (clothing model)" AS Clothing_Model,
    CASE
        WHEN colour = 1 THEN 'beige'
        WHEN colour = 2 THEN 'black'
        WHEN colour = 3 THEN 'blue'
        WHEN colour = 4 THEN 'brown'
        WHEN colour = 5 THEN 'burgundy'
        WHEN colour = 6 THEN 'gray'
        WHEN colour = 7 THEN 'green'
        WHEN colour = 8 THEN 'navy blue'
        WHEN colour = 9 THEN 'of many colors'
        WHEN colour = 10 THEN 'olive'
        WHEN colour = 11 THEN 'pink'
        WHEN colour = 12 THEN 'red'
        WHEN colour = 13 THEN 'violet'
        WHEN colour = 14 THEN 'white'
        ELSE 'Unknown'
    END AS colour_name,
    COUNT(*) AS Number_of_views
FROM
    testclickstream
GROUP BY
    "page 2 (clothing model)", colour, `page 1 (main category)`
ORDER BY
    Number_of_views DESC
LIMIT 10;
Session distribution by month
SELECT
    CASE
        WHEN month = 4 THEN 'April'
        WHEN month = 5 THEN 'May'
        WHEN month = 6 THEN 'June'
        WHEN month = 7 THEN 'July'
        WHEN month = 8 THEN 'August'
        ELSE 'Unknown'
    END AS month,
    COUNT(`session ID`) AS 'Total Number of Session'
FROM
    testclickstream
GROUP BY
    month;
Improving query performance by partitioning data
You can also partition data to improve query efficiency by defining the partition at setup or later. Partitioning is splitting log data based on specific columns and value pairs to improve query performance and storage efficiency.
In this example we can partition data based on category and color. However we should be careful not to over-partition the data; partitioning on columns with high cardinality (i.e. many unique values) can lead to over-partitioning and a large number of small partitions which can be inefficient. In this case we can easily over-partition by selecting session ID as a partition. You can monitor the query performance and adjust the partitions as needed. Well-partitioned data improves the response time even better when using large volumes. To learn more about partitioning data in Parseable go to the docs (link).
Visualizing with Grafana
Grafana is an open-source platform for monitoring visualization and analysis of metrics and log data. You can select from various charts tables and graphs to build interactive reports. We will use Grafana with Parseable to view all the metrics from a single interface. To get started you can download the open source version on your server and self-host or you can sign up for the free instance of Grafana Cloud to get started.
Integrating Grafana datasource
To set up Grafana to communicate with Parseable you can use the native Parseable datasource plugin.
Step 1: Log in to your Grafana instance and select "Add new connections" from the Connections tab. You will then see an interface to search for the plugin. Step 2: Search for and install the Parseable plugin. Step 3: Configure the Parseable datasource plugin to connect with your Parseable instance. You will need to use the URL of your Parseable instance and enter the basic authentication details.
Build a dashboard for your metrics
Once you have set up the datasource with Parseable you can go to the Explore tab and run one or all of the queries from the above.
By default you may get a tabular report. Select the "Add to the dashboard" button to add the report to the dashboard. From the card on the dashboard you can choose the visualization option to display the charts you need.
Take your clickstream data to the next level and see what these new insights can do for your business!
To learn more, visit our pricing page.
To get started or try Parseable, visit our demo page.