Parseable Release v1.3.0

Parseable v1.3.0 is out now! This release includes a good mix of new features, improvements, and bug fixes. In this post, we'll take a a detailed look at what’s new in this release.
We'll love to hear your feedback on this release. Please feel free to create an issue on our GitHub or join our Slack community.
New Features
Saved filters and queries in the explore logs view
A long-pending request from our community has been the ability to save a filter in order to return at a later date to a specific view without having to re-apply the filter from scratch. The same goes for queries.
We initially considered implementing this as a purely client-side feature, i.e. on the Console only, to deliver it more quickly. The idea was to use the browser's local store to keep a saved filter’s details and then load it from there on demand. But this approach would have been too limiting; for instance, the same user would not have been able to see their saved filters when logging in from a different browser or IP address. Also, sharing filters across users would not work and any browser event that cleared local storage would essentially mean the loss of all the saved filters, many of which are carefully created after months of analysis.
The other option was to do it correctly, i.e. a server-driven approach. All filters from a user are now reliably stored on the backend (the same store where log data is kept). There are API calls for all the CRUD operations related to filters, but instead of a database, we use S3 or disk as the store. We’ve seen this approach scale extremely well with the log data, and it made sense to follow a similar approach for user-saved filters.
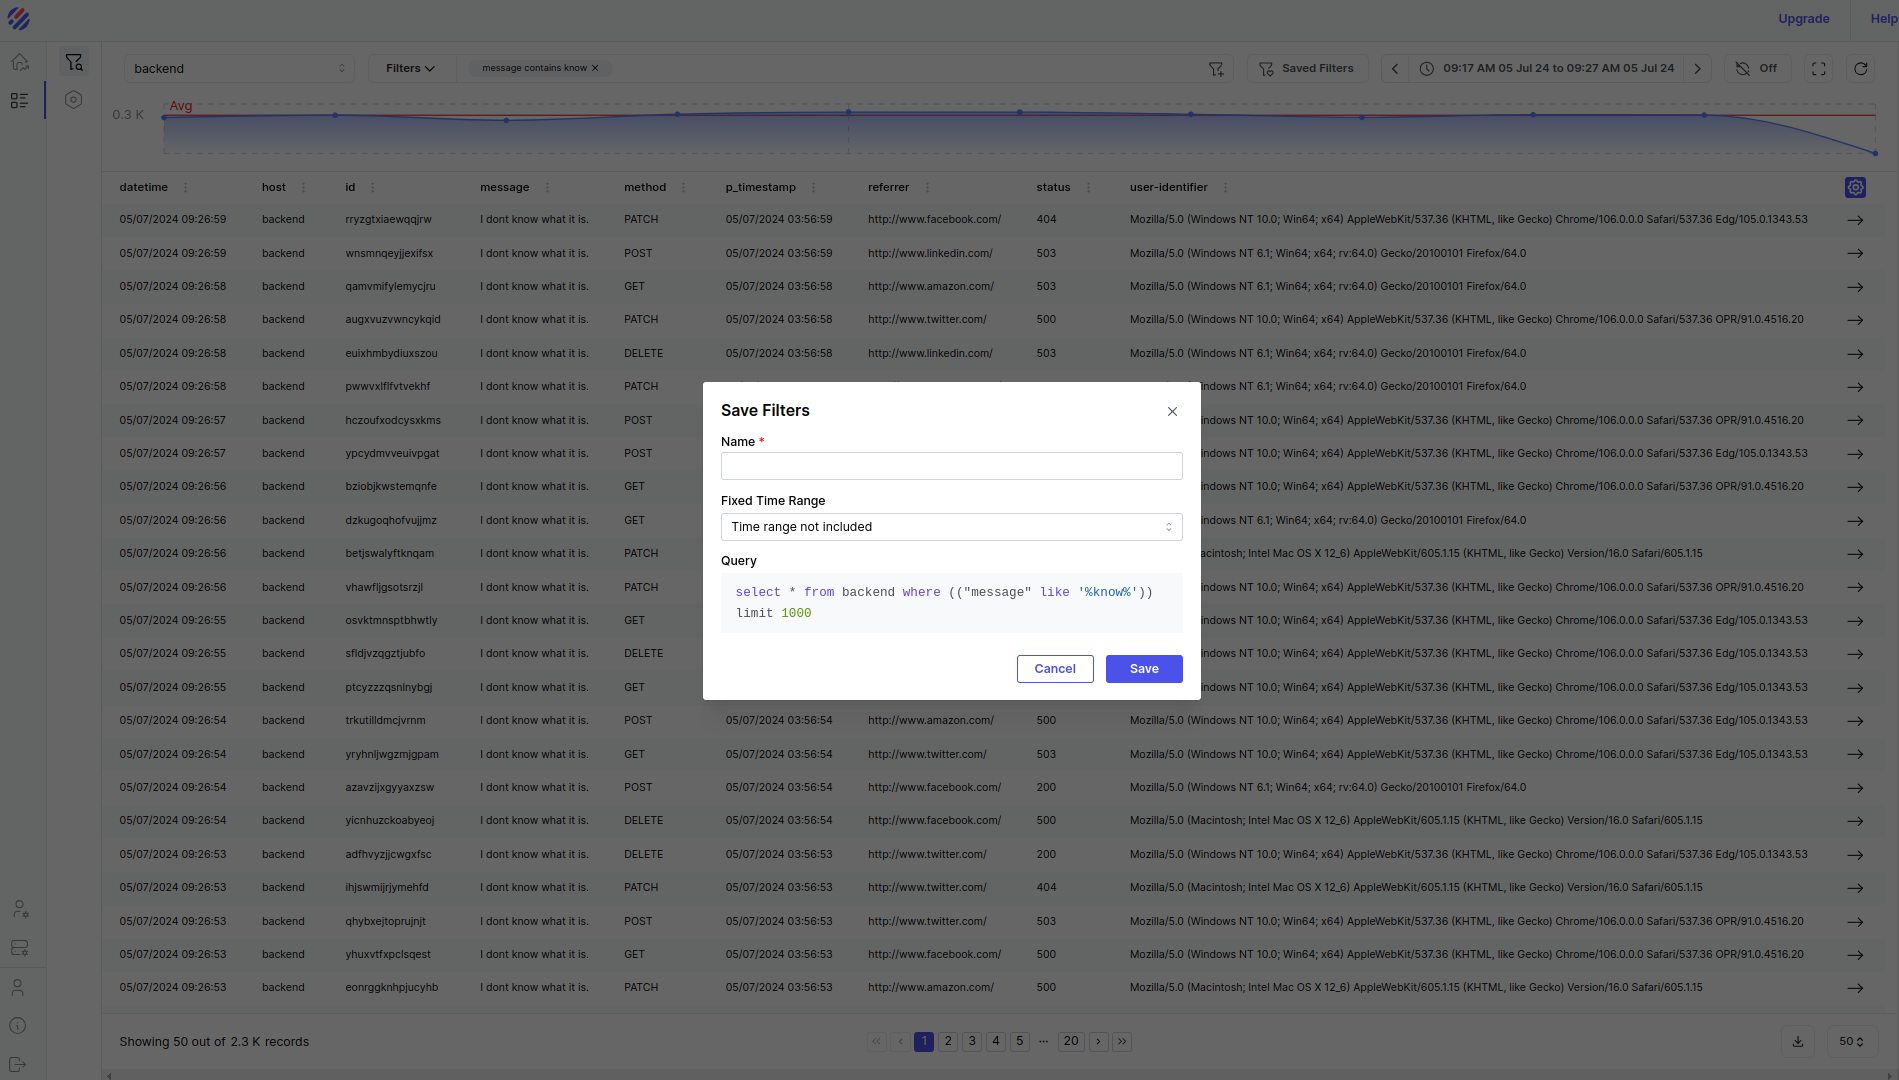
The explore page now includes the ability to save filters and apply them. A saved filter can also optionally include the time range. If you include the time range, this essentially means you’ll see the exact same data when you apply the filter. Otherwise, the same filter will be applied to whatever time range is already set.
Auto-completion in pb
If you like the command line, you’ll love pb, our command line client for Parseable. With the latest pb release, we’ve also added auto-completion to pb. You can now use the tab key to automatically complete the commands.
Improvements
S3 Call Optimization
-
We reduced S3 calls throughout various Parseable subsystems. This is done by keeping an in-memory system. This system is always updated and tries to serve results related to stream and its metadata from in memory, instead of an S3 call. This reduces costs for our customers further.
-
We also improved the stream creation flow in distributed mode. With this release, the querier node pushes updates to all live ingestor nodes at the time of stream creation and updating. This provides two benefits. First, it reduces the S3 calls needed because previously, the ingestor node had to check for a stream in S3 before starting ingestion. Second, it improves ingestion performance because the stream is already created and does not need to be checked before ingestion.
Bug Fixes
With the last release v1.2.0, there were reports of a few panic/crashes during certain workflows. We’ve taken time and deeply looked into these occurrences. The below issues were reproduced and fixed in this release:
a. panic caused in syncing invalid parquet files from staging to storage b. panic caused in resolving schema from invalid arrow files from staging c. panic caused in data type mismatches d. panic caused when using custom time partition in a stream and log event has null value in the time partition field e. panic caused when using custom column partitions in a stream and log event has null value in the column partition field
Load Testing
Performance under load is a key aspect of any data analytics system, and Parseable is no exception. As we progress, we’ll keep improving to ensure Parseable is the fastest purpose-built log analytics platform on the market. With this release onwards, we’ll publish details on ingestion performance. Even though we’ve been running these tests internally for a while, we’re now making them public.
Parseable Setup
Parseable was deployed on Kubernetes cluster in distributed mode. We set up 3 ingest nodes and 1 query node in the Parseable cluster. Each Parseable pod was allocated 2 vCPU and 4 GiB memory. We also ensured to deploy each pod on a separate node to avoid any resource contention.
Load Generation
We use K6 on Kubernetes for load testing. K6 is a modern load testing tool that allows you to write test scripts in JavaScript. For simpler deployment and ease in scale out, we used the K6 Operator. Refer the steps we followed to set up K6 on Kubernetes in this blog post.
The load testing script is available in the Quest repository. The load testing script generates a single HTTP request with several events batched. This script is configurable with:
- Number of schema
P_SCHEMA_COUNT- total number of different schema types present in a single HTTP call. - Number of events
P_EVENTS_COUNT- total number of events per schema to be sent in a single batch. - Virtual users VUs - the simulated users that run separate and concurrent iterations of this test script. This is a K6 construct.
For example if you’ve set P_SCHEMA_COUNT=30 and P_EVENTS_COUNT=40 and VUs are set to 10, this means there will be 10 virtual processes running this script in parallel. Each iteration of the script will generate a total of 1200 events in a single HTTP call (sent to the Parseable server). In this 1200 events, you’ll have 40 events of a single schema, next 40 events with a different schema and so on.
Results
Test Run 1: 1 Query, 3 Ingestor Nodes. 2 vCPU, 4 Gi Memory each node. 9 k6 clients to ingest data, Number of batches per http requests - 300, Run time: 10 mins
| Metric | Ingestor1 | Ingestor2 | Ingestor3 | Total |
|---|---|---|---|---|
| HTTP Requests Count | 81317 | 73610 | 83384 | 238311 |
| Total Events Ingested in 10 mins (HTTP Requests * Number of Batches per Request) | 24395100 | 22083000 | 25015200 | 71493300 |
| Total Events Ingested in 1 sec | 40658.5 | 36805 | 41692 | 119155.5 |
| Throughput in MB/sec | 44.5 MB/s |
Test Run 2: 1 Query, 3 Ingestor Nodes, 2 vCPU, 4 Gi Memory each node, 15 k6 clients to ingest data, Number of batches per http requests - 300, Run time: 10 mins
| Metric | Ingestor1 | Ingestor2 | Ingestor3 | Total |
|---|---|---|---|---|
| HTTP Requests Count | 123603 | 118308 | 107871 | 349782 |
| Total Events Ingested in 10 mins (HTTP Requests * Number of Batches per Request) | 37080900 | 35492400 | 32361300 | 104934600 |
| Total Events Ingested in 1 sec | 61801.5 | 59154 | 53935.5 | 174891 |
| Throughput in MB/sec | 65.5 MB/s |
Test Run 3: 1 Query, 3 Ingestor Nodes, 3 vCPU, 4 Gi Memory each node, 15 k6 clients to ingest data, Number of batches per http requests - 300, Run time: 10 mins
| Metric | Ingestor1 | Ingestor2 | Ingestor3 | Total |
|---|---|---|---|---|
| HTTP Requests Count | 136036 | 138804 | 124195 | 399035 |
| Total Events Ingested in 10 mins (HTTP Requests * Number of Batches per Request) | 40810800 | 41641200 | 37258500 | 119710500 |
| Total Events Ingested in 1 sec | 68018 | 69402 | 62097.5 | 199517.5 |
| Throughput in MB/sec | 74.7 MB/s |
Test Run 4: 1 Query, 3 Ingestor Nodes, 3 vCPU, 4 Gi Memory each node, 15 k6 clients to ingest data, Number of batches per http requests - 525, Run time: 10 mins
| Metric | Ingestor1 | Ingestor2 | Ingestor3 | Total |
|---|---|---|---|---|
| HTTP Requests Count | 83811 | 86633 | 74761 | 245205 |
| Total Events Ingested in 10 mins (HTTP Requests * Number of Batches per Request) | 44000775 | 45482325 | 39249525 | 128732625 |
| Total Events Ingested in 1 sec | 73334.625 | 75803.875 | 65415.875 | 214554.375 |
| Throughput in MB/sec | 76.8 MB/s |