

Introduction
In the world of database management, monitoring and analyzing PostgreSQL performance metrics is crucial for maintaining optimal system health. This blog post demonstrates how to create an insightful monitoring dashboard by combining Parseable's data collection capabilities with Apache Superset's powerful visualization features. We'll walk through setting up a comprehensive monitoring solution that helps track various PostgreSQL metrics including table sizes, scan patterns, and database operations.
Prerequisites
- PostgreSQL database up and running
- OpenTelemetry Collector configured to collect PostgreSQL metrics. Refer: https://www.parseable.com/blog/step-by-step-guide-postgresql-observability-with-fluentbit-and-opentelemetry
- Parseable instance running and collecting metrics
- Python 3.x installed
Installing Apache Superset
# Create and activate a virtual environment (recommended)
python -m venv superset-env
source superset-env/bin/activate  # On Windows: superset-env\Scripts\activate

# Install Apache Superset
pip install apache-superset

# Install Parseable SQLAlchemy driver
pip install sqlalchemy-parseable==0.1.4

# Initialize Superset
superset db upgrade
superset fab create-admin
superset init

# Run Superset
superset run -p 8088 --with-threads --reload --debugger
Configuring Parseable as a Data Source
-
Log into Superset
-
Navigate to Data → Databases
-
Click "+ Database"
-
Add Parseable connection details:
parseable://username:password@host:port/streamname -
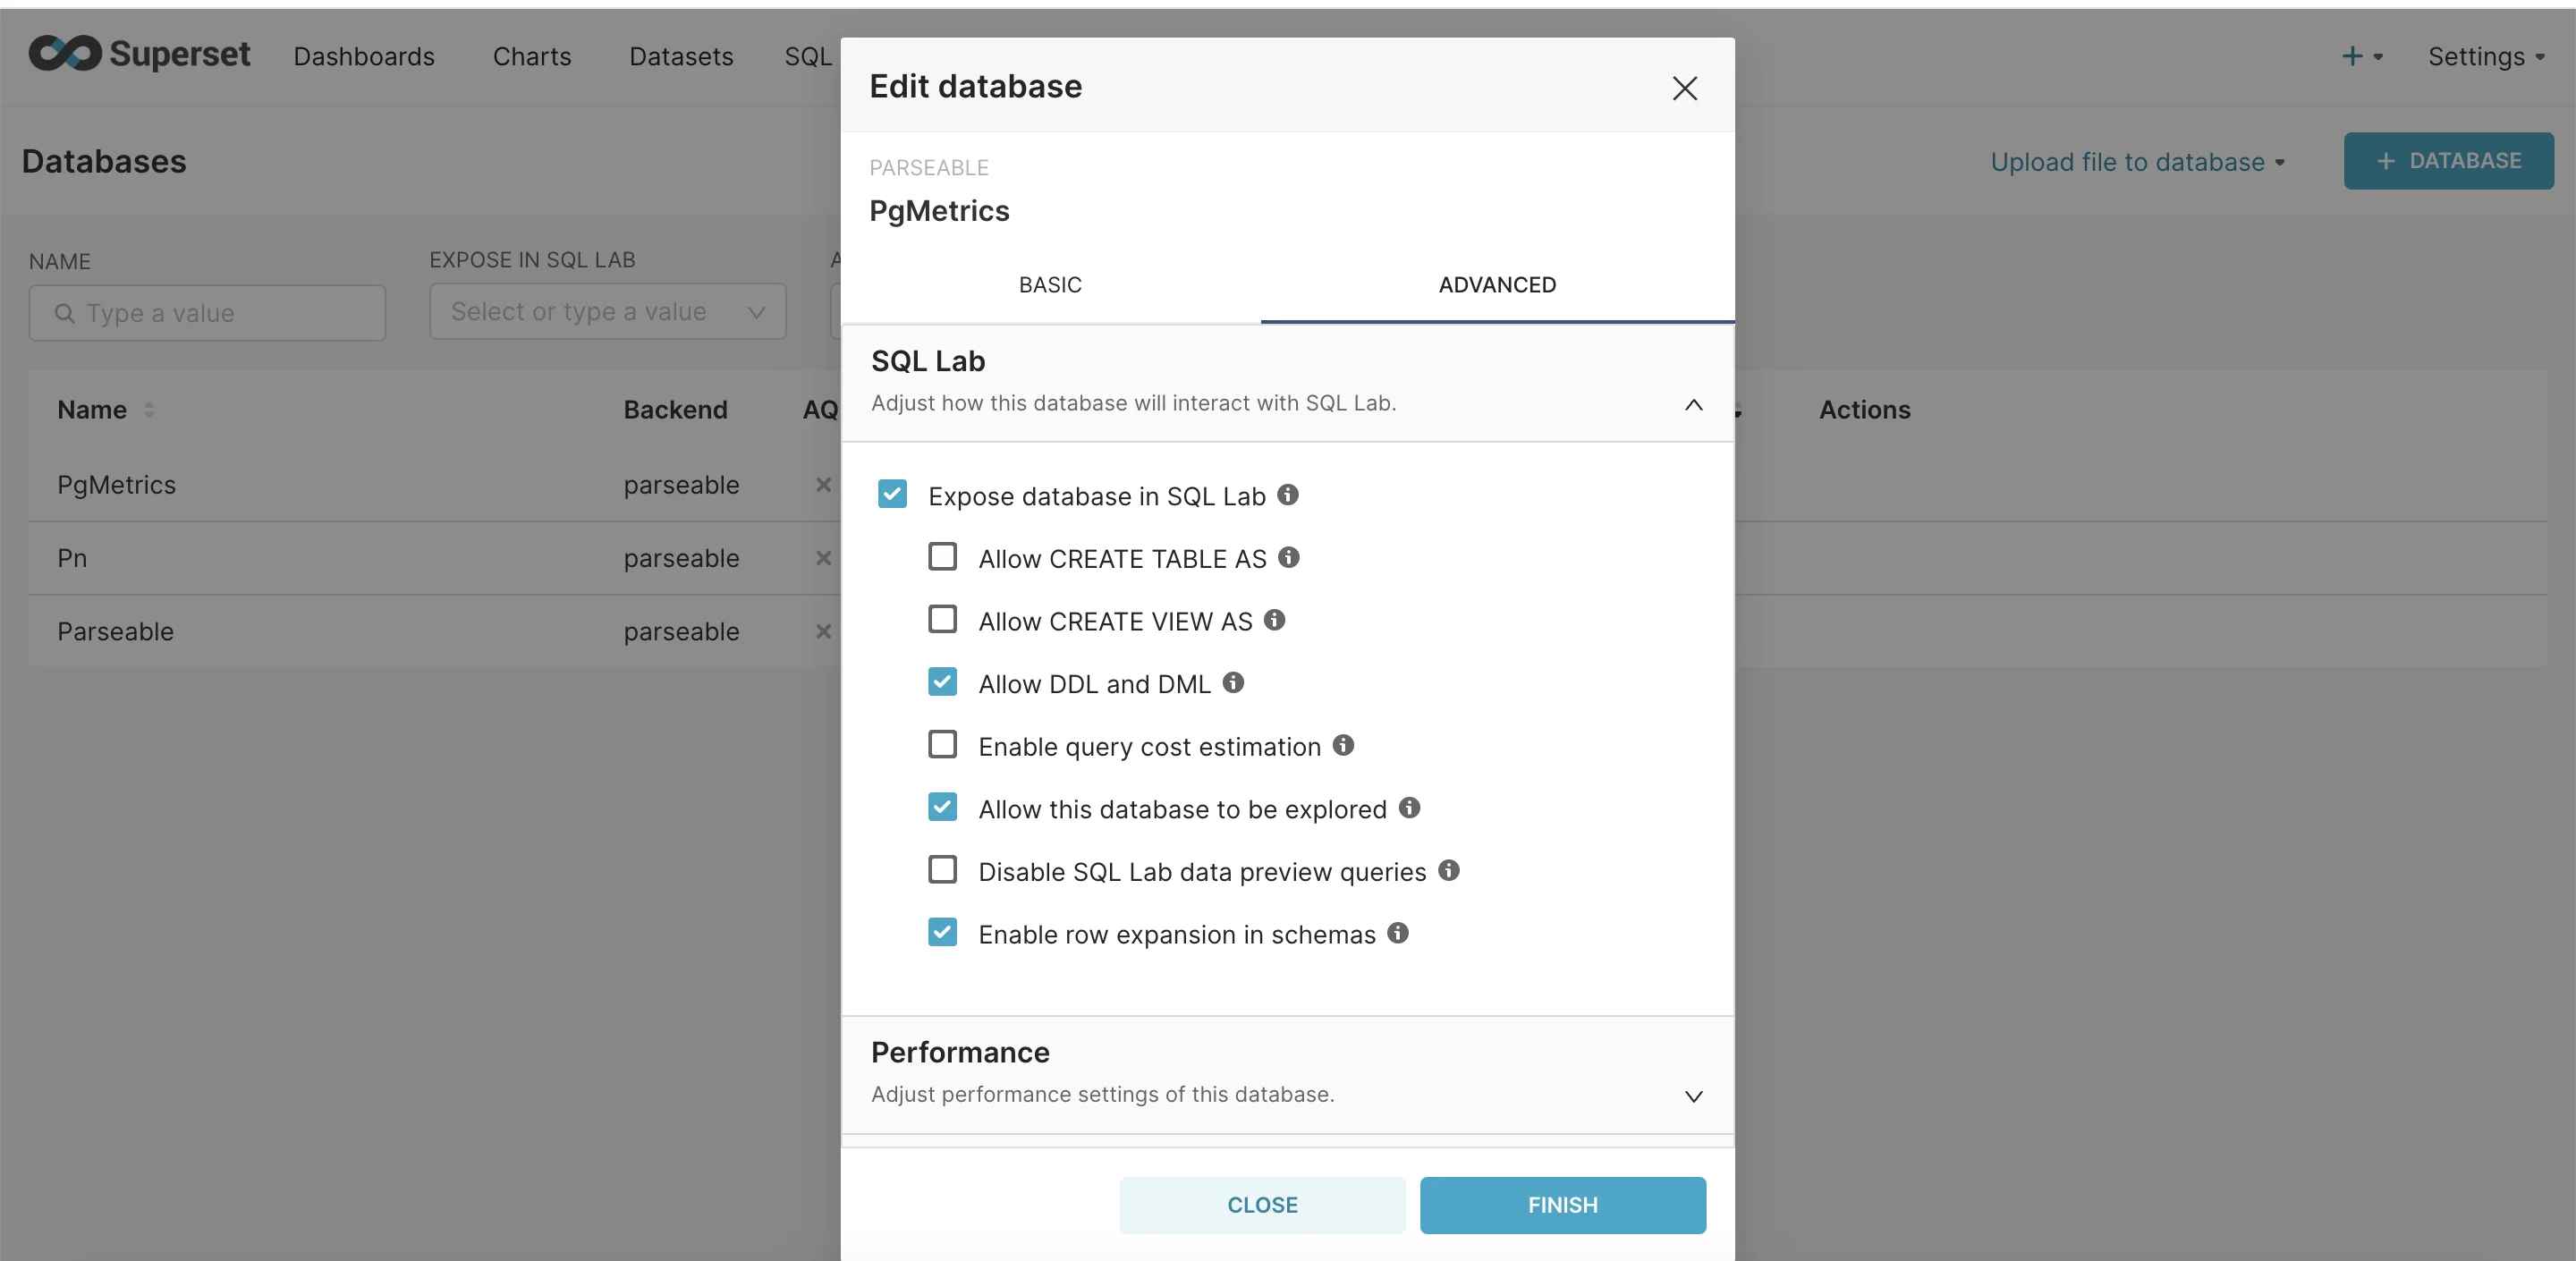
Enable SQL Labs in the advanced section.
Creating the Dashboard
Index vs Sequential Scans
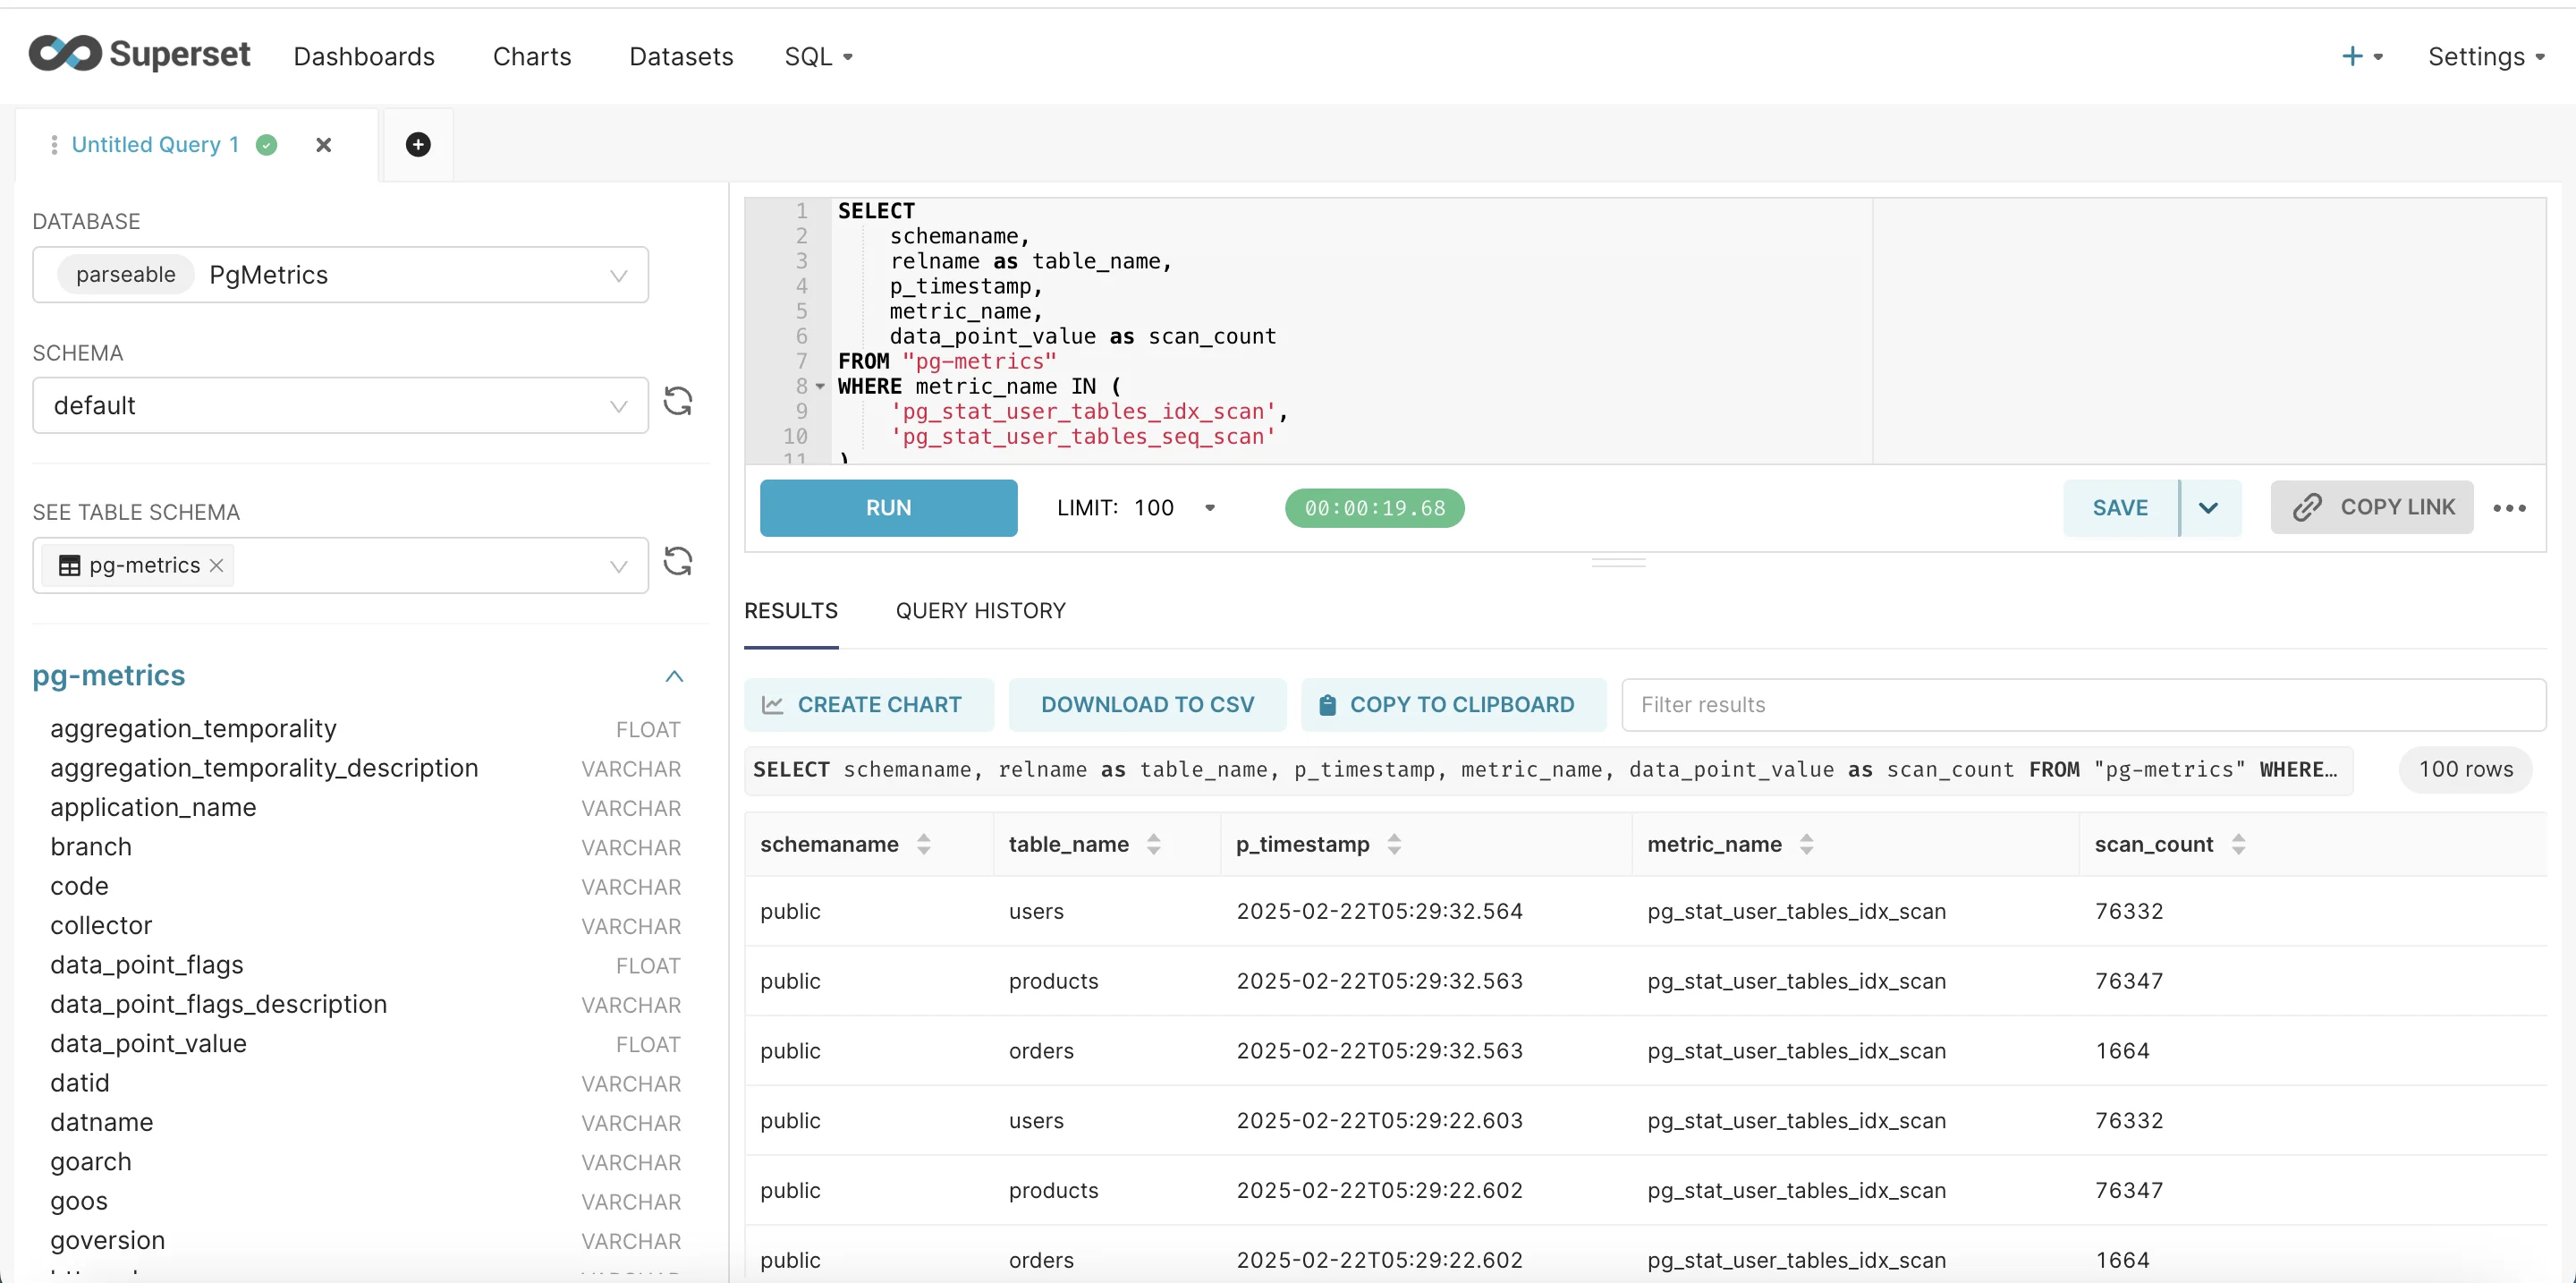
- Navigate to SQL Lab
- Enter the query
SELECT
    schemaname,
    relname as table_name,
    p_timestamp,
    metric_name,
    data_point_value as scan_count
FROM "pg-metrics"
WHERE metric_name IN (
    'pg_stat_user_tables_idx_scan',
    'pg_stat_user_tables_seq_scan'
)
AND schemaname = 'public';
Once you have executed the SQL query, go ahead and click create chart.
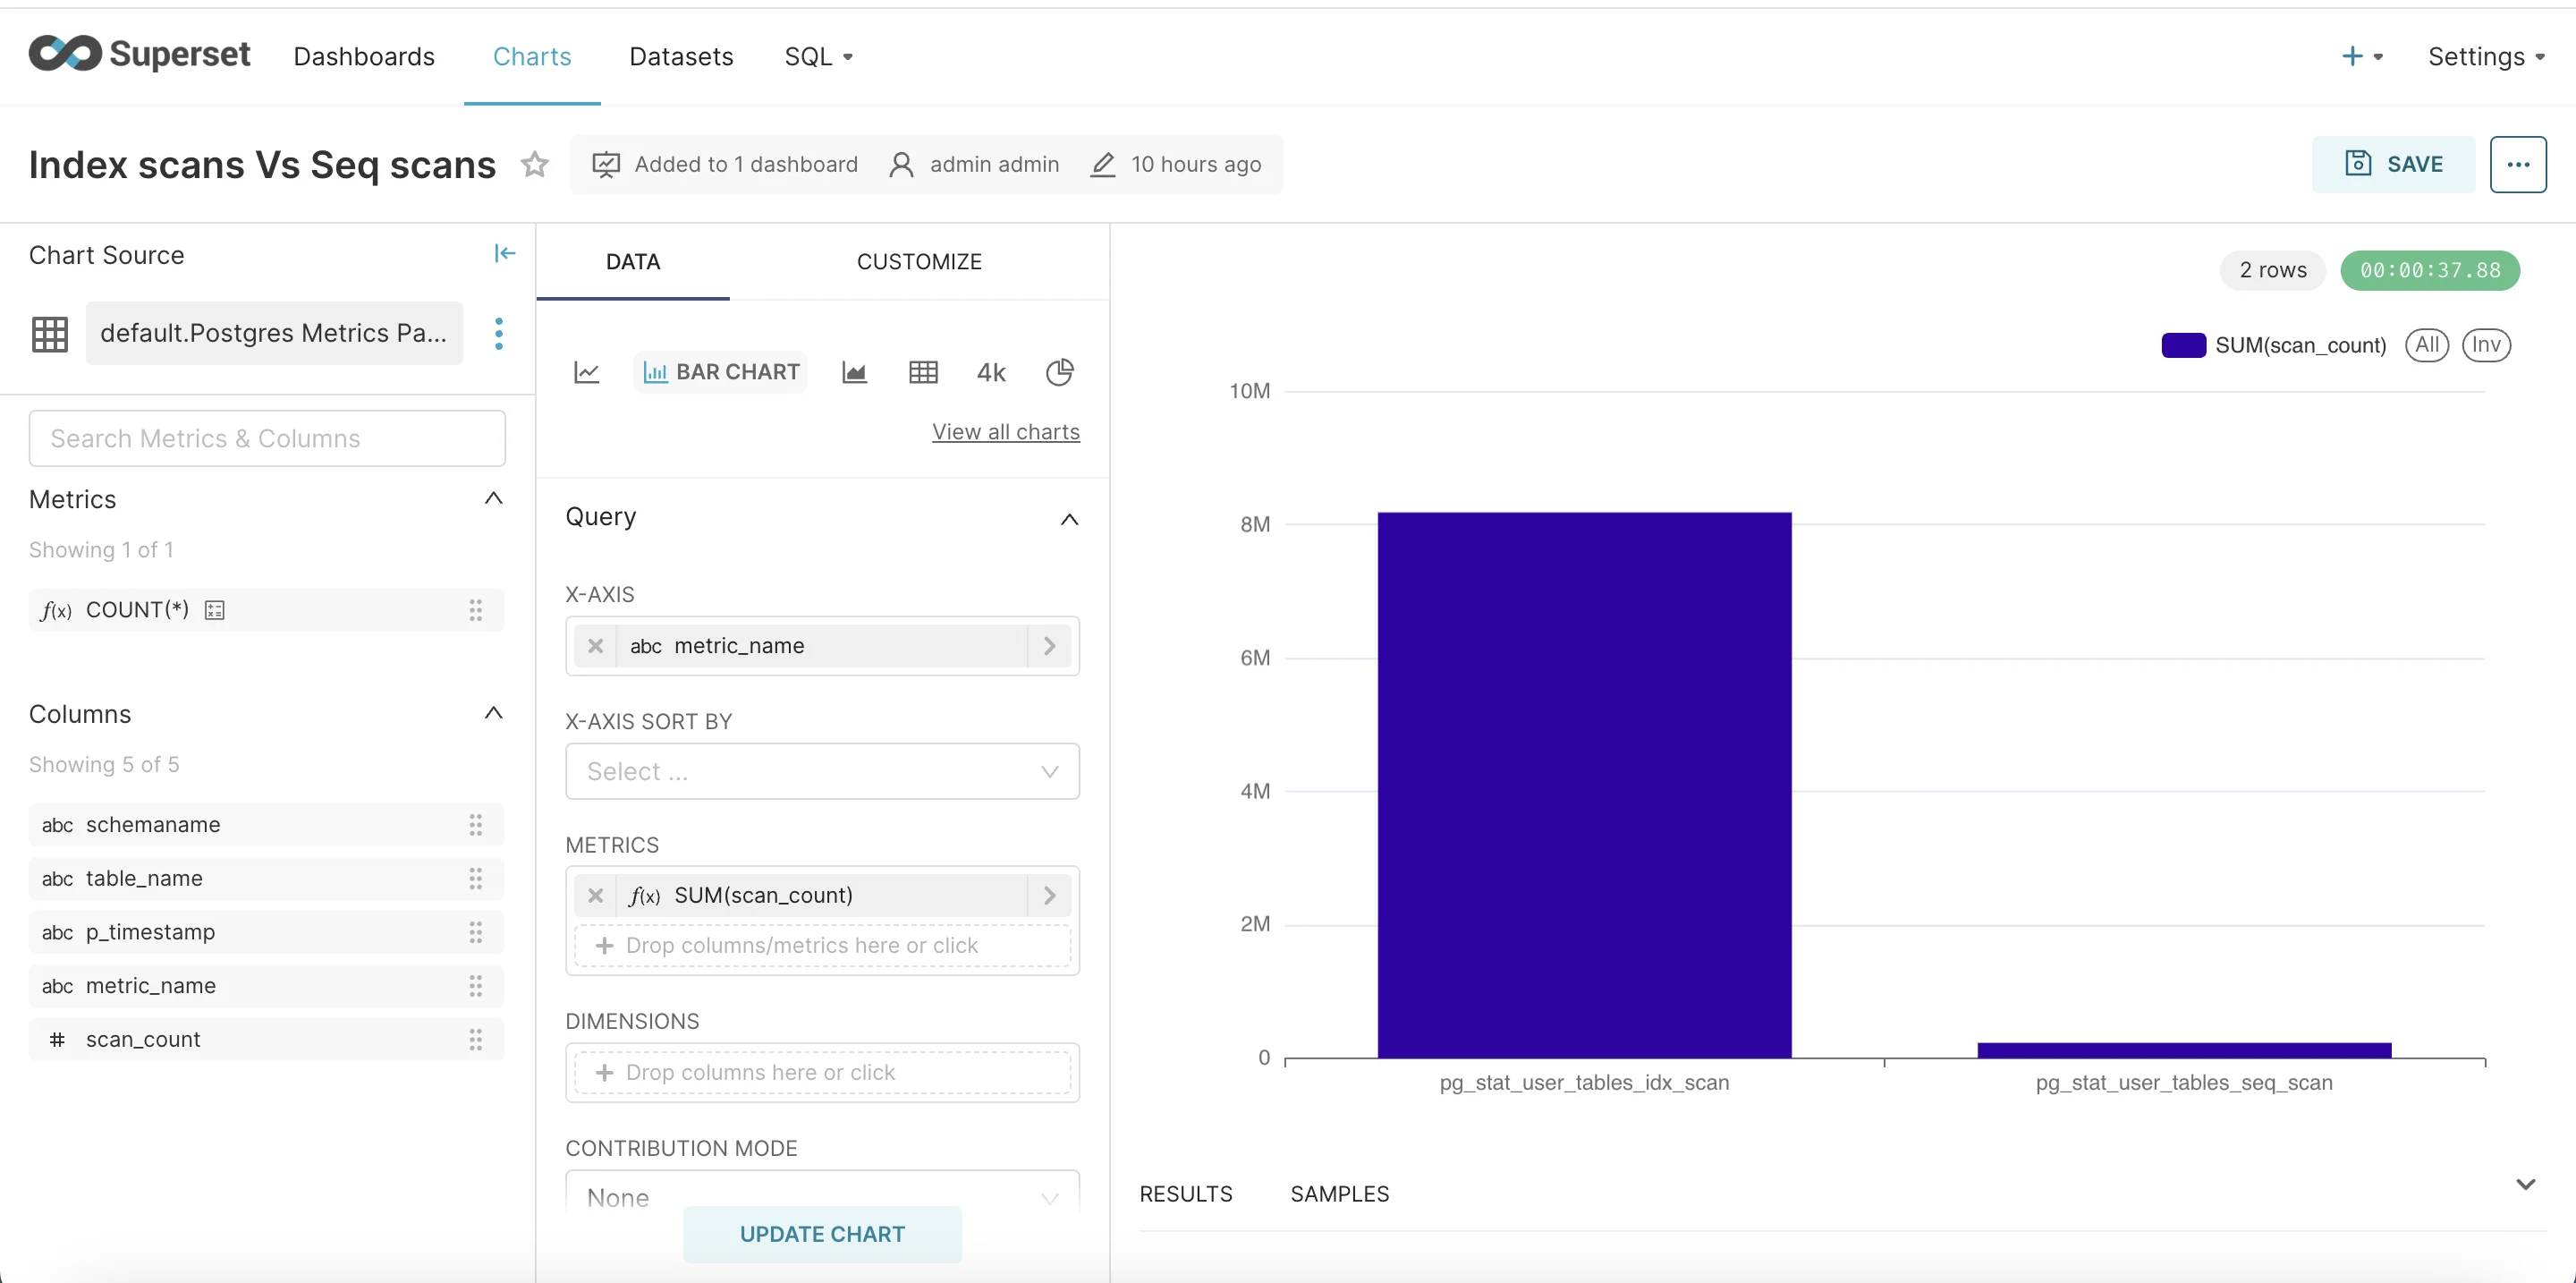
Once you click on create chart. In chart let’s choose bar chart as visualisation.
- In X-Axis select table_name.
- In Metrics select metric_name as column and aggregate SUM.
- Update Chart and Save to Dashboard.
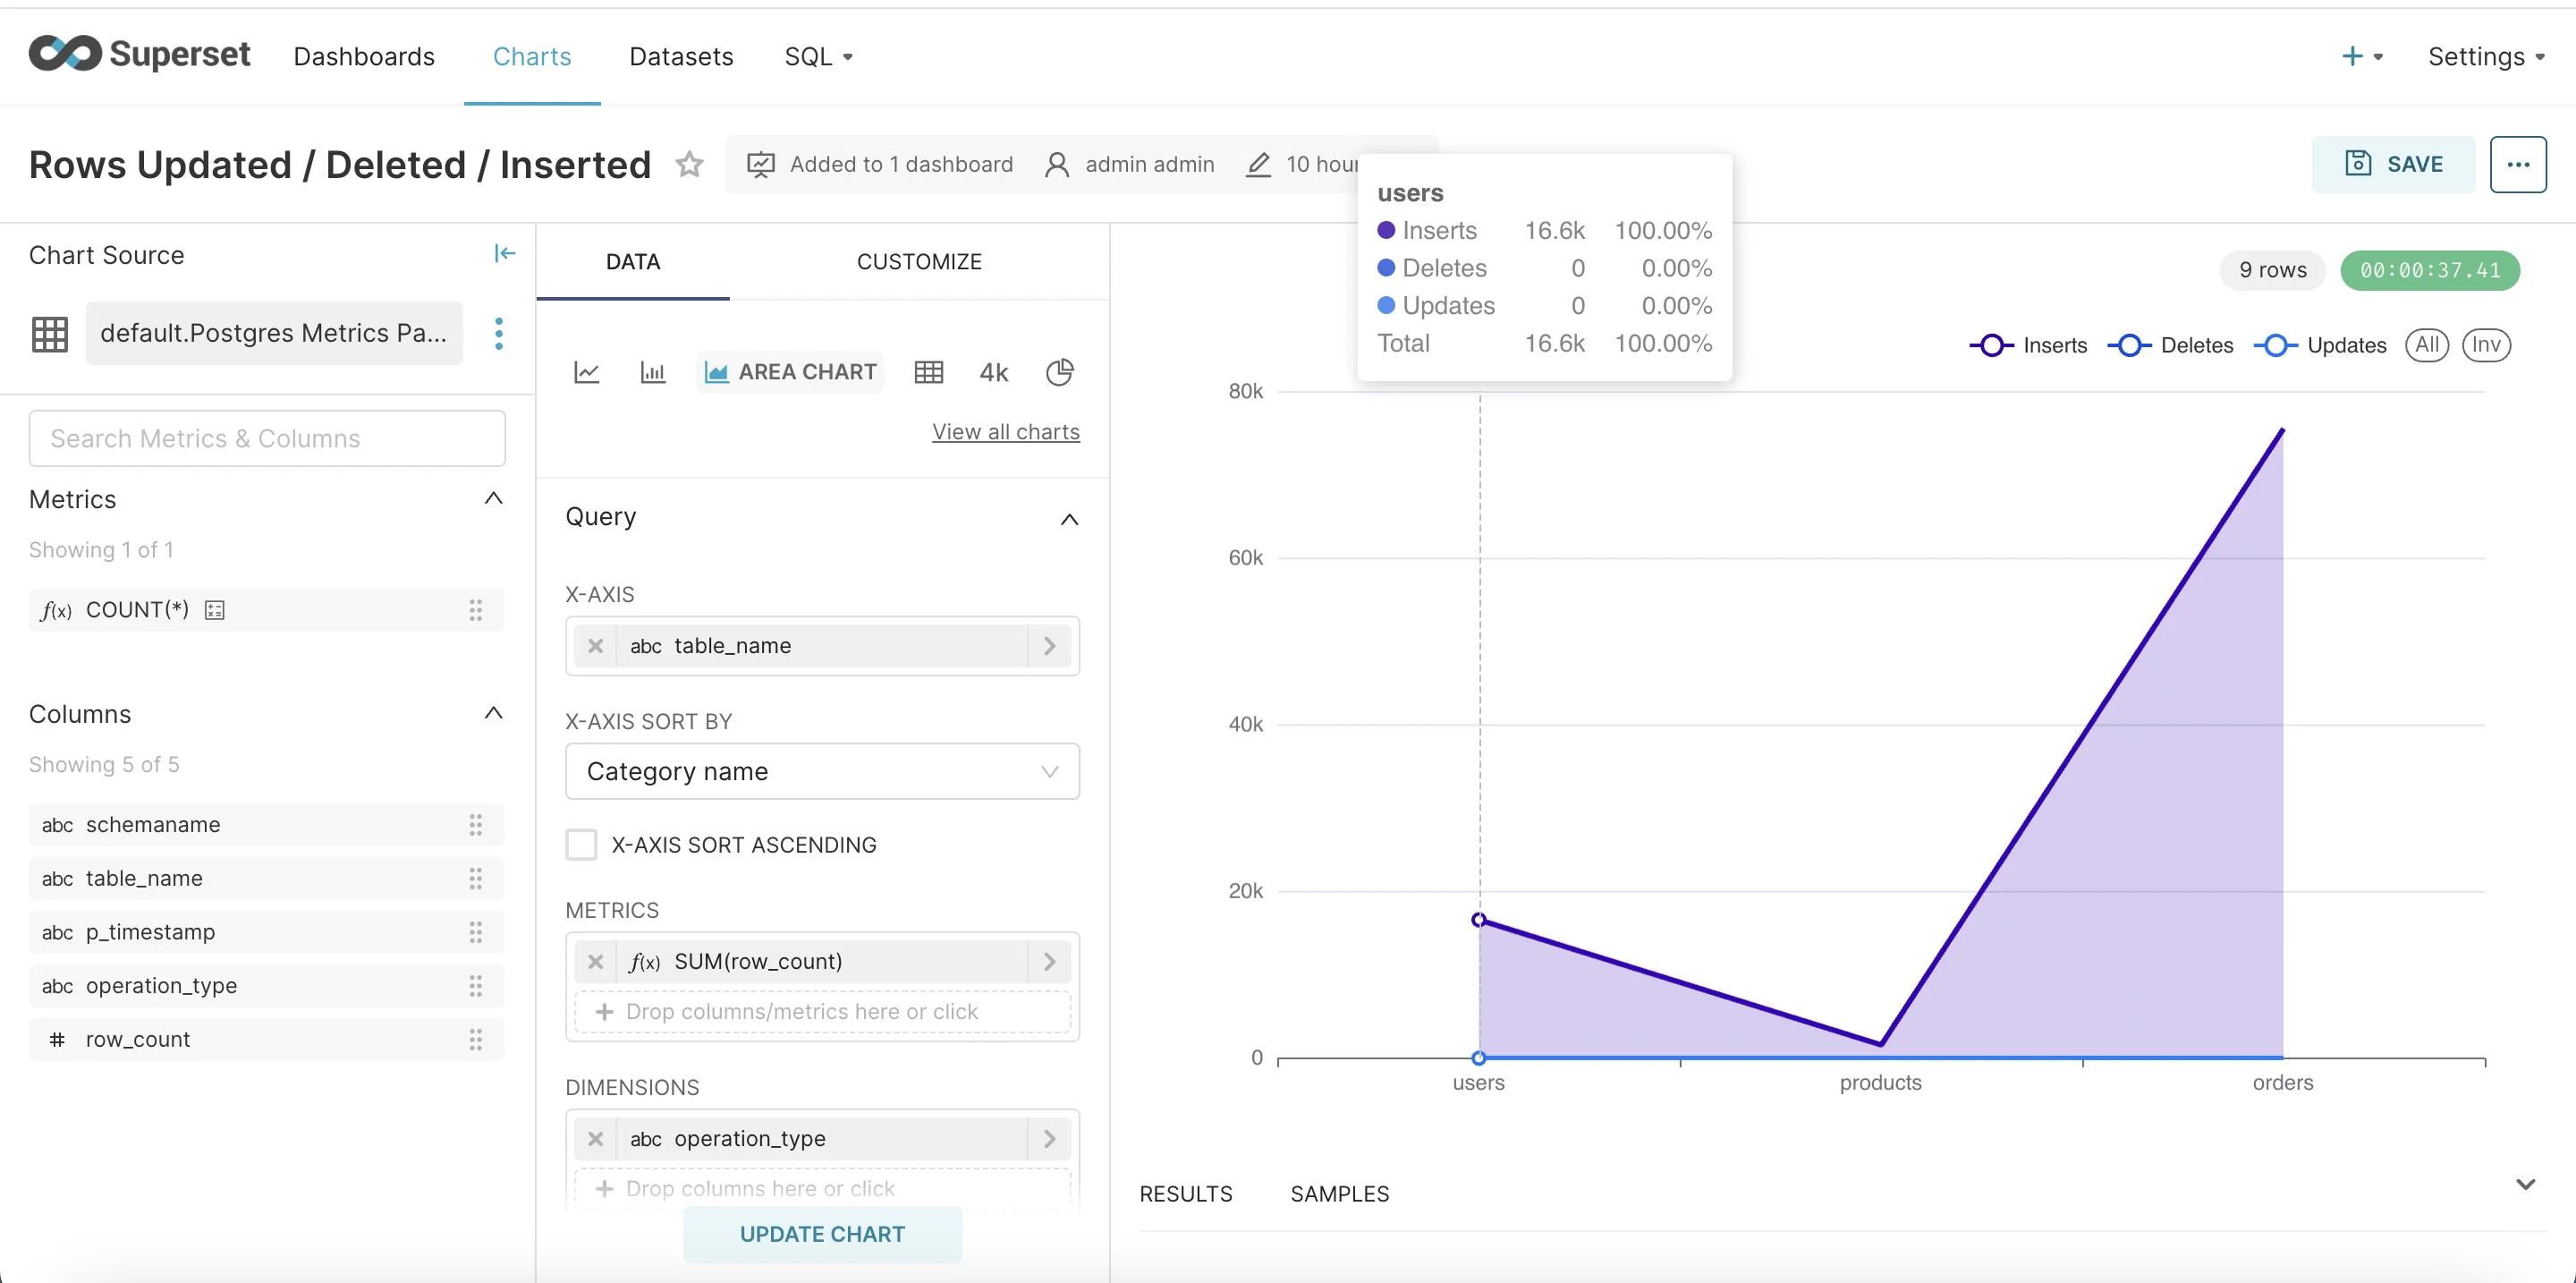
Rows Updated / Deleted / Inserted
Another interesting metric to visualise is rows updates, deletes and inserts.
Let’s go to SQL labs and execute this query.
WITH row_operations AS (
    SELECT
        schemaname,
        relname as table_name,
        p_timestamp,
        CASE
            WHEN metric_name = 'pg_stat_user_tables_n_tup_ins' THEN 'Inserts'
            WHEN metric_name = 'pg_stat_user_tables_n_tup_upd' THEN 'Updates'
            WHEN metric_name = 'pg_stat_user_tables_n_tup_del' THEN 'Deletes'
        END as operation_type,
        data_point_value as row_count,
        ROW_NUMBER() OVER (PARTITION BY schemaname, relname, metric_name ORDER BY p_timestamp DESC) as rn
    FROM "pg-metrics"
    WHERE metric_name IN (
        'pg_stat_user_tables_n_tup_ins',
        'pg_stat_user_tables_n_tup_upd',
        'pg_stat_user_tables_n_tup_del'
    )
    AND schemaname = 'public'
)
SELECT
    schemaname,
    table_name,
    p_timestamp,
    operation_type,
    row_count
FROM row_operations
WHERE rn = 1
ORDER BY table_name, operation_type;
Now let’s select area chart.
- Add table_name in x-axis.
- In metrics choose column as row_count and aggregate SUM.
- Add a dimension operation_type to slice the data.
Summary
In this guide, we walked through creating a comprehensive PostgreSQL monitoring solution that combines the power of Parseable metrics collection with Apache Superset's visualization capabilities.
Additional Resources

