In the previous blog post, we explored how to set up PostgreSQL metrics collection using the PostgreSQL exporter, OpenTelemetry Collector, and Parseable.
In this post, let’s take a deeper look into the metrics and logs. Specifically, how to use this telemetry to figure out performance bottlenecks in read / write paths and understand cache utilization.
Please note that this post starts where previous post ended. If you haven’t already, please read the previous blog post and set up PostgreSQL logs and metrics pipeline.
Available Metrics
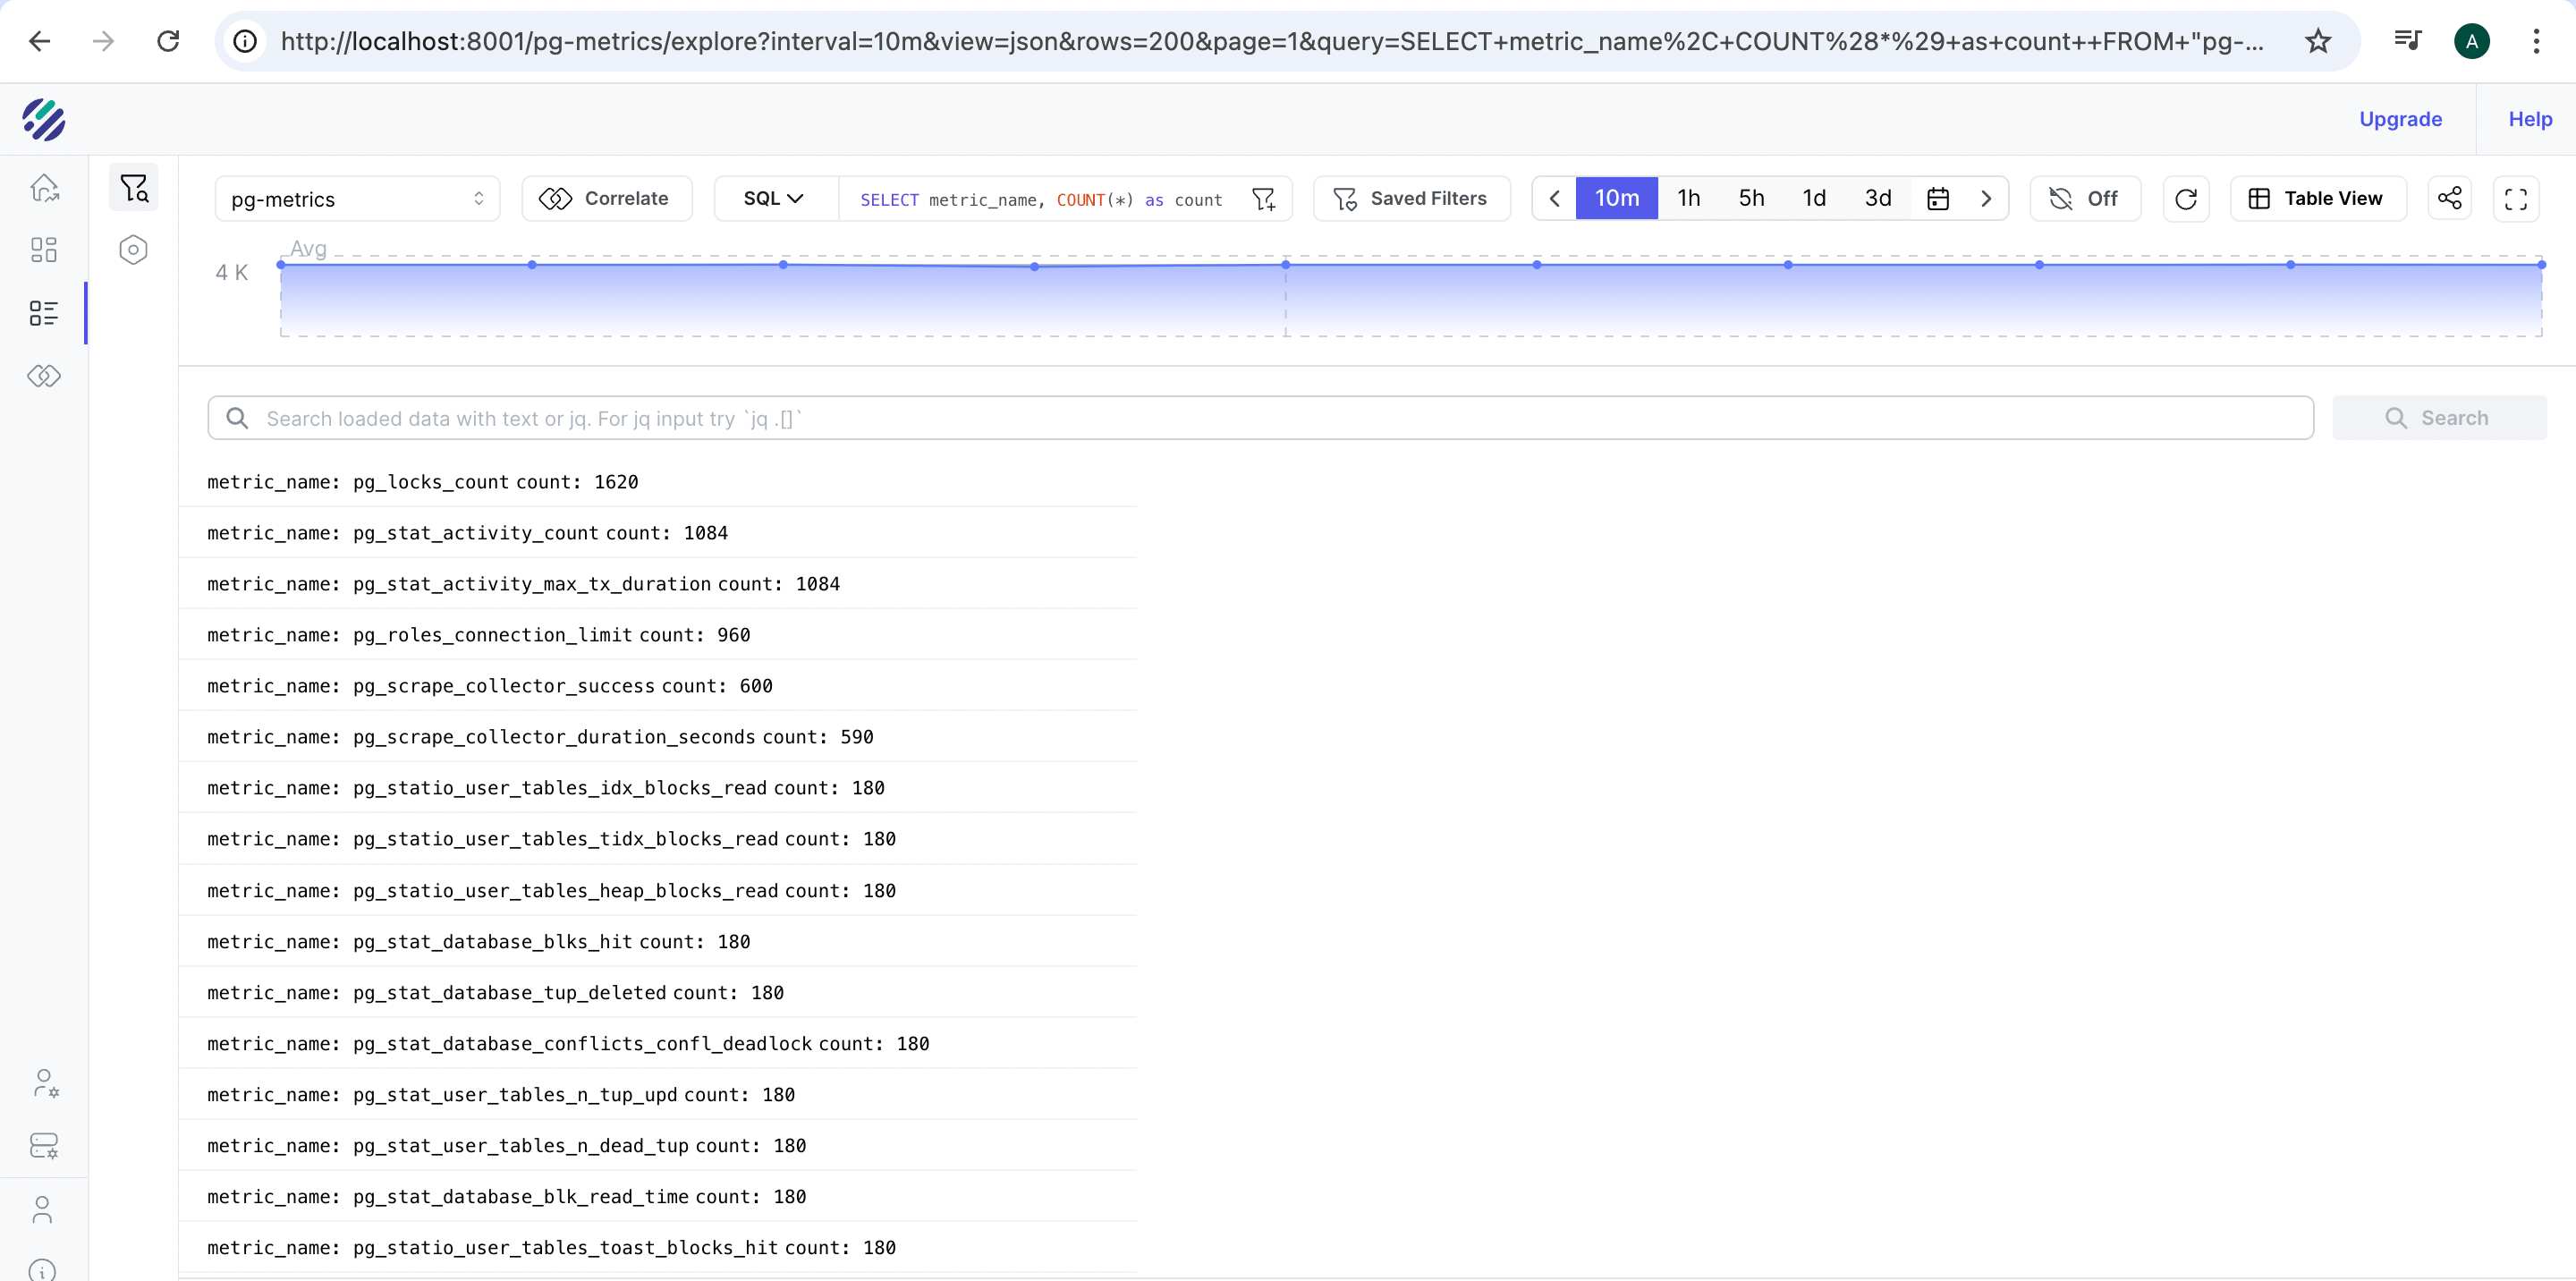
First, let's see what metrics we have available in our Parseable instance. You can use the SQL query below, to get a comprehensive list:
SELECT metric_name, COUNT(*) as count
FROM "pg-metrics"
WHERE metric_name IS NOT NULL
GROUP BY metric_name
ORDER BY count DESC
LIMIT 1000
This query gives us an overview of all PostgreSQL metrics being collected and their frequency.
Read Query Performance Analysis
Now that we’ve confirmed data present on the Parseable server, let’s look at analyzing Read Query Performance of the PostgreSQL database.
Read query performance is crucial for maintaining a healthy PostgreSQL database. This metric helps you track how fast end users are able to get their query responses.
There are two key metrics to us analyze read performance.
-
postgresql.tup_returned
- Represents the total number of rows scanned/processed by queries
- Includes ALL rows that PostgreSQL examines to produce the result
- These rows may or may not be returned to the client
- Think of this as "rows processed internally"
-
postgresql.tup_fetched
- Represents the number of rows actually returned to the client
- These are the rows that matched your WHERE clause and other conditions
- Think of this as "rows in the final result set"
The ratio of these two metrics gives a great way to understand the efficiency of the read query.
Efficiency Ratio = tup_returned / tup_fetched
Different patterns in this efficiency ratio tell us about your database's performance:
-
Normal Patterns
- Ratio close to 1: Indicates perfect index usage.
- Small consistent ratio: Shows well-optimized queries.
-
Problematic Patterns
- High ratio spikes: Indicates sudden inefficient queries.
- Steadily increasing ratio: Suggests degrading performance.
- Very high stable ratio: Points to consistently poor query patterns.
SQL Query to find efficiency ratio
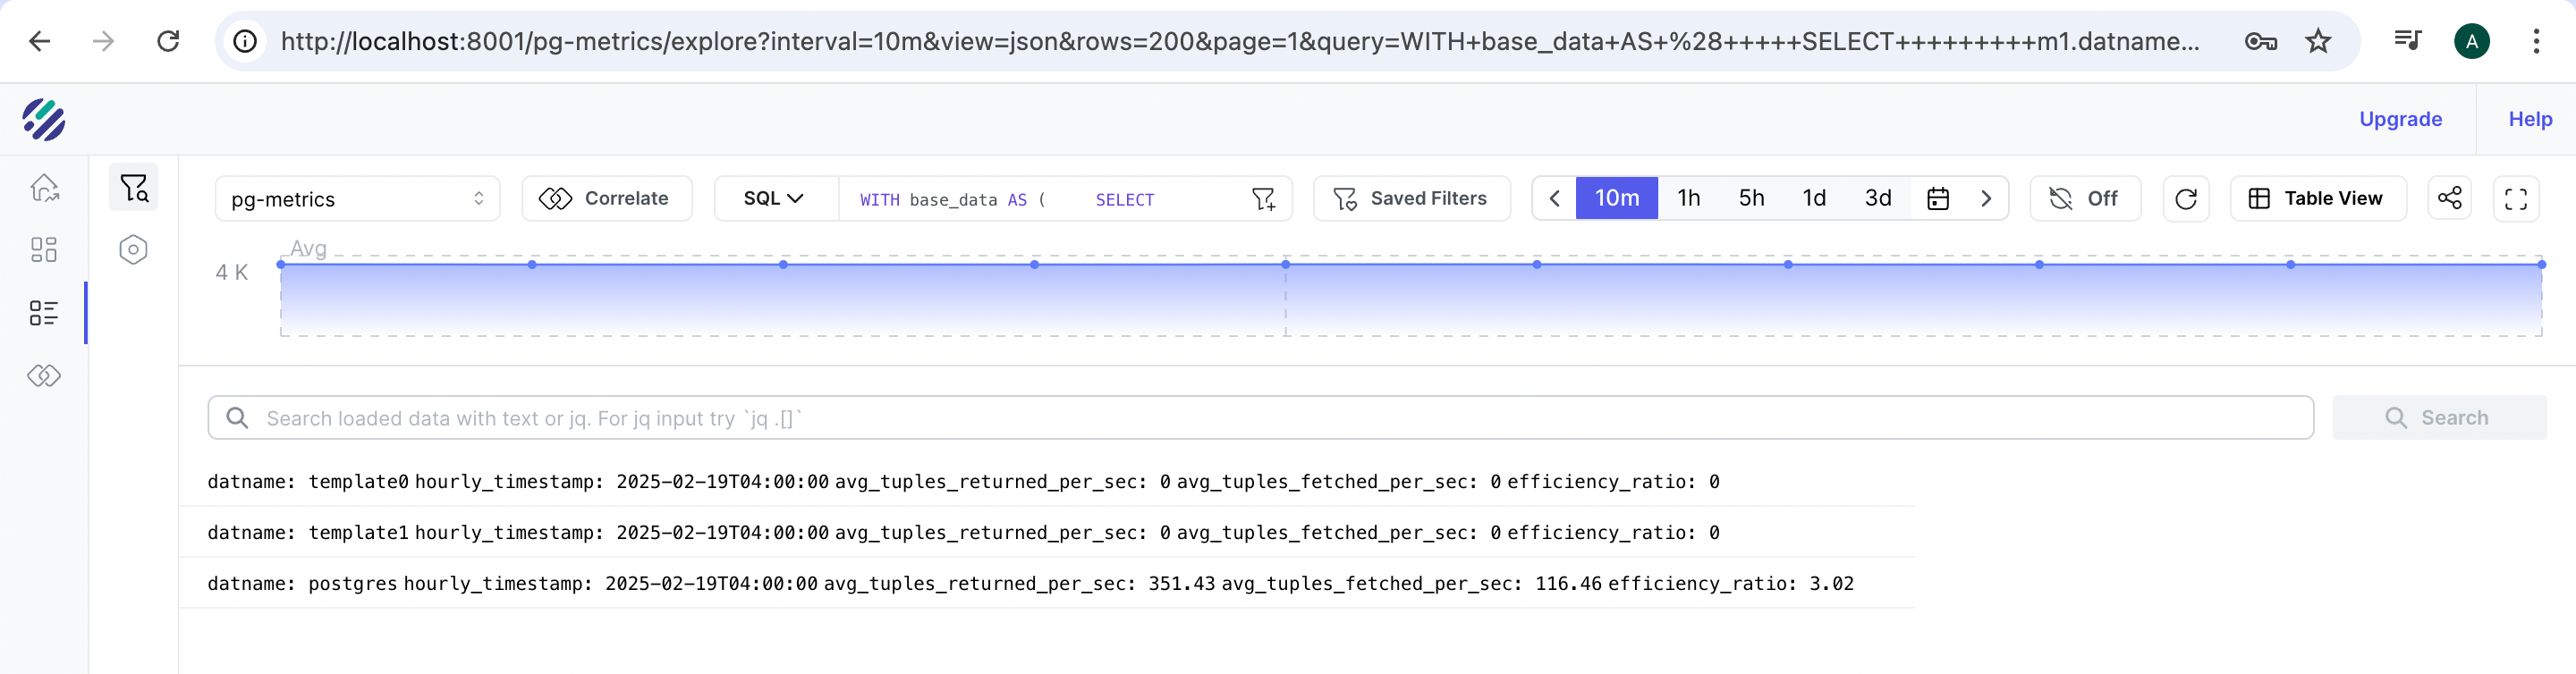
Here's a comprehensive SQL query to analyze this ratio over time:
WITH base_data AS (
    SELECT
        m1.datname,
        m1.p_timestamp,
        m1.data_point_value as tup_returned,
        m2.data_point_value as tup_fetched
    FROM "pg-metrics" m1
    JOIN "pg-metrics" m2
        ON date_trunc('second', m1.p_timestamp) = date_trunc('second', m2.p_timestamp)
        AND m1.datname = m2.datname
    WHERE m1.metric_name = 'pg_stat_database_tup_returned'
    AND m2.metric_name = 'pg_stat_database_tup_fetched'
),
rate_calc AS (
    SELECT
        datname,
        p_timestamp,
        (tup_returned - LAG(tup_returned) OVER (PARTITION BY datname ORDER BY p_timestamp)) /
        EXTRACT(EPOCH FROM (p_timestamp - LAG(p_timestamp) OVER (PARTITION BY datname ORDER BY p_timestamp))) as tup_returned_per_sec,
        (tup_fetched - LAG(tup_fetched) OVER (PARTITION BY datname ORDER BY p_timestamp)) /
        EXTRACT(EPOCH FROM (p_timestamp - LAG(p_timestamp) OVER (PARTITION BY datname ORDER BY p_timestamp))) as tup_fetched_per_sec
    FROM base_data
)
SELECT
    datname,
    date_trunc('hour', p_timestamp) as hourly_timestamp,
    ROUND(AVG(tup_returned_per_sec), 2) as avg_tuples_returned_per_sec,
    ROUND(AVG(tup_fetched_per_sec), 2) as avg_tuples_fetched_per_sec,
    CASE
        WHEN AVG(tup_fetched_per_sec) > 0
        THEN ROUND((AVG(tup_returned_per_sec) / AVG(tup_fetched_per_sec))::numeric, 2)
        ELSE 0
    END as efficiency_ratio
FROM rate_calc
WHERE tup_returned_per_sec IS NOT NULL
GROUP BY datname, date_trunc('hour', p_timestamp)
ORDER BY hourly_timestamp DESC;
Let's break down what this query does:
- The
base_dataCTE joins the returned and fetched metrics on timestamp and database name - The
rate_calcCTE calculates per-second rates using window functions - The final SELECT aggregates data by hour and calculates the efficiency ratio
Block Hit and Read Analysis
Another crucial aspect of read performance is understanding how effectively PostgreSQL uses its buffer cache. There are two key metrics to understand and track buffer cache usage:
- postgresql.blks_hit: Number of blocks read from memory cache
- postgresql.blocks_read: Number of blocks read from disk
The cache hit ratio is calculated as:
Cache Hit Ratio = blocks_hit / (blocks_hit + blocks_read)) * 100
This metric tells us how often PostgreSQL finds the data it needs in memory versus having to read from disk.
Performance Thresholds
-
Cache Hit Ratio:
- < 90%: Problematic - indicates too many disk reads
- 90-95%: Acceptable but room for improvement
- 95-99%: Good performance
-
99%: Excellent performance
-
Blocks Read (disk reads):
-
Should maintain a stable pattern
-
Sudden increases might indicate:
- New tables being accessed
- Full table scans
- Index inefficiency
-
-
Blocks Hit (cache hits):
-
Should show steady increase
-
Sharp drops might indicate:
- Cache eviction
- Memory pressure
- Competing workloads
-
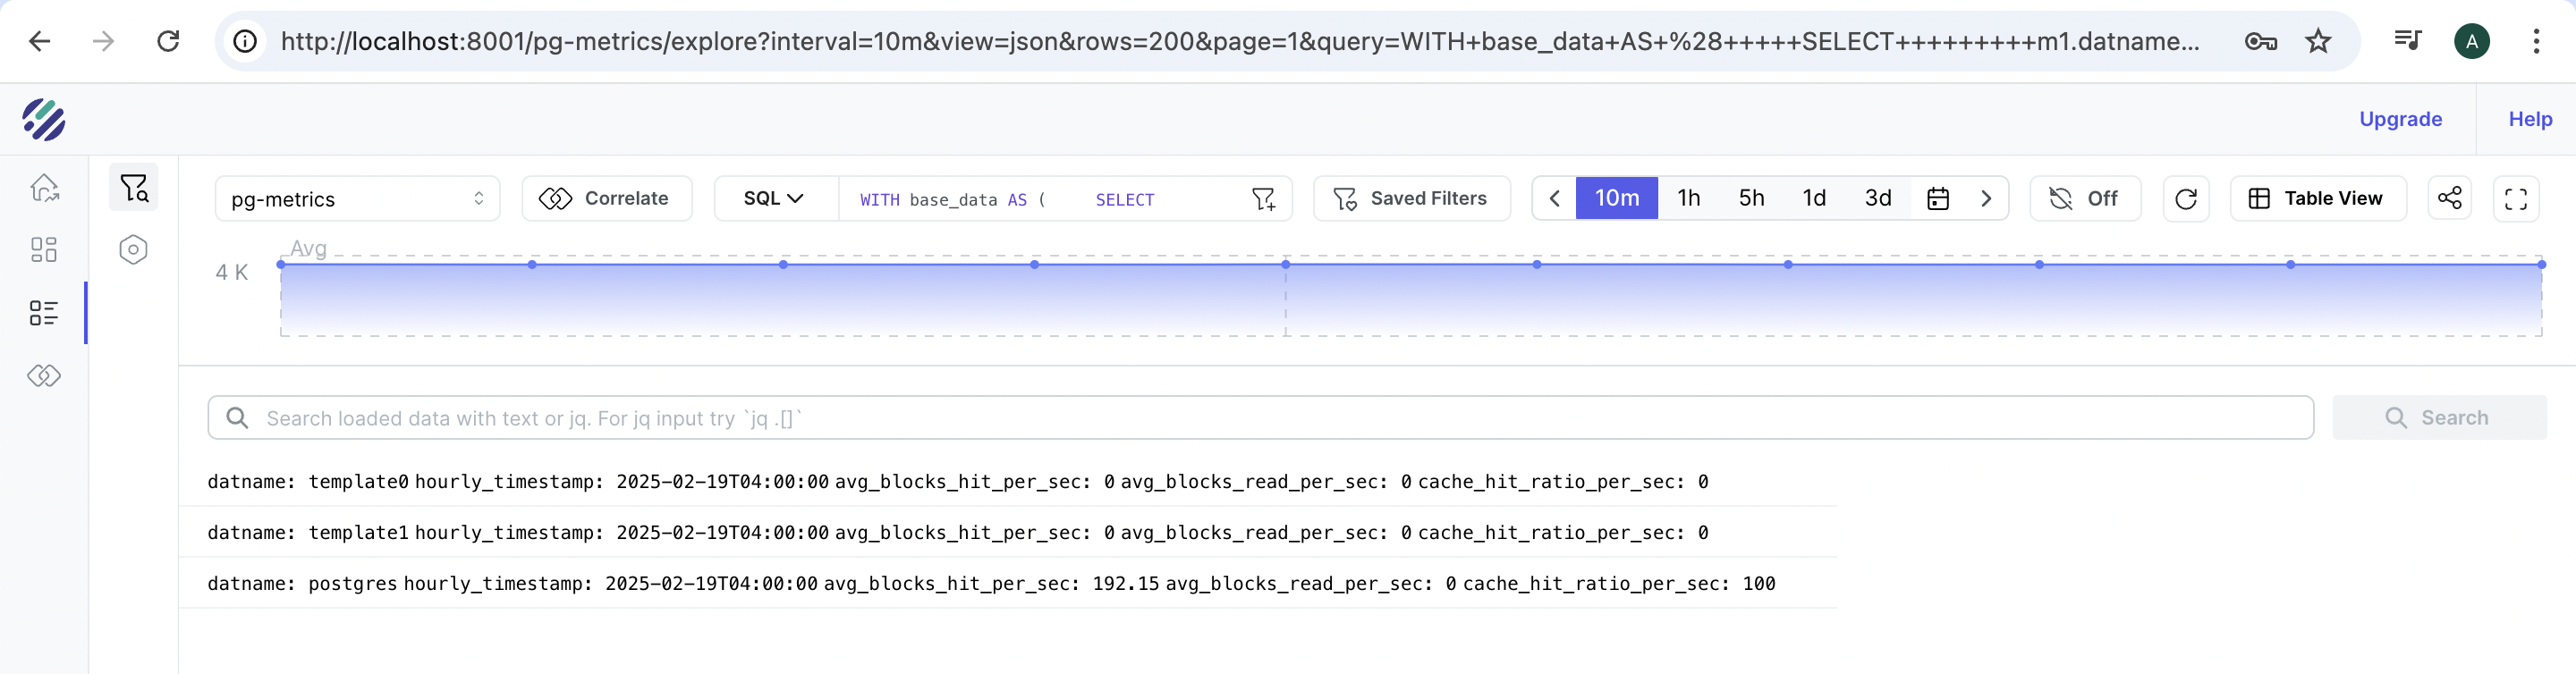
SQL Query to find cache hit ratio
WITH base_data AS (
    SELECT
        m1.datname,
        m1.p_timestamp,
        m1.data_point_value as blocks_hit,
        m2.data_point_value as blocks_read
    FROM "pg-metrics" m1
    JOIN "pg-metrics" m2
        ON date_trunc('second', m1.p_timestamp) = date_trunc('second', m2.p_timestamp)
        AND m1.datname = m2.datname
    WHERE m1.metric_name = 'pg_stat_database_blks_hit'
    AND m2.metric_name = 'pg_stat_database_blks_read'
),
rate_calc AS (
    SELECT
        datname,
        p_timestamp,
        (blocks_hit - LAG(blocks_hit) OVER (PARTITION BY datname ORDER BY p_timestamp)) /
        EXTRACT(EPOCH FROM (p_timestamp - LAG(p_timestamp) OVER (PARTITION BY datname ORDER BY p_timestamp))) as blocks_hit_per_sec,
        (blocks_read - LAG(blocks_read) OVER (PARTITION BY datname ORDER BY p_timestamp)) /
        EXTRACT(EPOCH FROM (p_timestamp - LAG(p_timestamp) OVER (PARTITION BY datname ORDER BY p_timestamp))) as blocks_read_per_sec
    FROM base_data
)
SELECT
    datname,
    date_trunc('hour', p_timestamp) as hourly_timestamp,
    ROUND(AVG(blocks_hit_per_sec), 2) as avg_blocks_hit_per_sec,
    ROUND(AVG(blocks_read_per_sec), 2) as avg_blocks_read_per_sec,
    CASE
        WHEN (AVG(blocks_hit_per_sec) + AVG(blocks_read_per_sec)) > 0
        THEN ROUND((AVG(blocks_hit_per_sec) / (AVG(blocks_hit_per_sec) + AVG(blocks_read_per_sec)) * 100)::numeric, 2)
        ELSE 0
    END as cache_hit_ratio_per_sec
FROM rate_calc
WHERE blocks_hit_per_sec IS NOT NULL
GROUP BY datname, date_trunc('hour', p_timestamp)
ORDER BY hourly_timestamp DESC;
Write Performance Analysis
Write performance is equally important and can be analyzed through several key metrics. Let's look at how to track and analyze write operations:
sqlCopyWITH base_data AS (
    SELECT
        m1.datname,
        m1.p_timestamp,
        m1.data_point_value as tup_inserted,
        m2.data_point_value as tup_updated,
        m3.data_point_value as tup_deleted
    FROM "pg-metrics" m1
    JOIN "pg-metrics" m2
        ON date_trunc('second', m1.p_timestamp) = date_trunc('second', m2.p_timestamp)
        AND m1.datname = m2.datname
    JOIN "pg-metrics" m3
        ON date_trunc('second', m1.p_timestamp) = date_trunc('second', m3.p_timestamp)
        AND m1.datname = m3.datname
    WHERE m1.metric_name = 'pg_stat_database_tup_inserted'
    AND m2.metric_name = 'pg_stat_database_tup_updated'
    AND m3.metric_name = 'pg_stat_database_tup_deleted'
),
rate_calc AS (
    SELECT
        datname,
        p_timestamp,
        (tup_inserted - LAG(tup_inserted) OVER (PARTITION BY datname ORDER BY p_timestamp)) /
        EXTRACT(EPOCH FROM (p_timestamp - LAG(p_timestamp) OVER (PARTITION BY datname ORDER BY p_timestamp))) as inserts_per_sec,
        (tup_updated - LAG(tup_updated) OVER (PARTITION BY datname ORDER BY p_timestamp)) /
        EXTRACT(EPOCH FROM (p_timestamp - LAG(p_timestamp) OVER (PARTITION BY datname ORDER BY p_timestamp))) as updates_per_sec,
        (tup_deleted - LAG(tup_deleted) OVER (PARTITION BY datname ORDER BY p_timestamp)) /
        EXTRACT(EPOCH FROM (p_timestamp - LAG(p_timestamp) OVER (PARTITION BY datname ORDER BY p_timestamp))) as deletes_per_sec
    FROM base_data
)
SELECT
    datname,
    date_trunc('minute', p_timestamp) as minute_timestamp,
    ROUND(AVG(inserts_per_sec), 2) as avg_inserts_per_sec,
    ROUND(AVG(updates_per_sec), 2) as avg_updates_per_sec,
    ROUND(AVG(deletes_per_sec), 2) as avg_deletes_per_sec,
    ROUND(AVG(inserts_per_sec + updates_per_sec + deletes_per_sec), 2) as avg_total_writes_per_sec
FROM rate_calc
WHERE inserts_per_sec IS NOT NULL
GROUP BY datname, date_trunc('minute', p_timestamp)
ORDER BY minute_timestamp DESC
LIMIT 100;
Understanding Write Metrics
-
Write Operation Rates:
- avg_inserts_per_sec: Rate of new rows being added
- avg_updates_per_sec: Rate of existing rows being modified
- avg_deletes_per_sec: Rate of rows being removed
- avg_total_writes_per_sec: Overall write load
-
Performance Thresholds:
- Normal: ≤ 100 operations/second
- Moderate: ≤ 500 operations/second
- High: ≤ 1000 operations/second
- Excessive: > 1000 operations/second
Write Pattern Analysis
-
Insert Patterns:
-
High rates indicate:
- Bulk data loading
- High-volume data ingestion
- Batch processing operations
-
-
Update Patterns:
-
Elevated rates suggest:
- Frequent data modifications
- Batch update operations
- Possible opportunities for bulk updates
-
-
Delete Patterns:
-
High rates might indicate:
- Data cleanup operations
- Regular purge processes
- Potential for batch deletion optimization
-
Additional Write-Related Metrics
Also monitor these metrics for a complete picture:
- postgresql.bgwriter.buffers.writes: Background writer activity
- postgresql.bgwriter.duration: Time spent writing
- postgresql.temp_files: Temporary file usage
Taking Action
For Read Performance Issues:
-
Poor Cache Hit Ratio:
- Increase shared_buffers if memory allows
- Review table and index sizes
- Consider table partitioning
-
High Block Read Rates:
- Analyze query patterns
- Review and optimize indexes
- Consider materialized views
For Write Performance Issues:
-
High Insert Rates:
- Consider bulk insert operations
- Review index strategy
- Analyze partitioning strategy
-
Elevated Update/Delete Rates:
- Look for batch operation opportunities
- Review trigger impact
- Consider VACUUM strategy
Conclusion
By monitoring both read and write metrics in Parseable, you can:
- Identify performance bottlenecks early
- Make informed decisions about optimization
- Track the impact of your changes
Understanding these metrics helps maintain optimal database performance and plan for growth. The SQL queries provided here give you a solid foundation for building your own monitoring dashboards in Parseable.