

Since childhood, I have been fascinated with car ads. The majority of ads across the world showcase cars reaching 0-60 MPH in a certain number of seconds, as one of the most important features. It always felt exhilarating to see these ads.
But as I grew, and eventually started looking for my first car, it dawned on me, a faster car isn’t going to get me to work faster. A faster car by itself won't necessarily keep me safe. Fast cars did however feel great to drive.
In reality, what makes a car truly valuable to most owners isn't just raw speed, but a balanced combination of reliability, fuel efficiency, comfort, safety features, and yes, reasonable performance. Car manufacturers know this, yet they continue to emphasize performance because that’s easy to measure, compare, and tap into our instinctive attraction to speed. We're drawn to these simple metrics even when our actual needs are far more complex.
Performance in data stores is similar. A faster query response in itself is good to have, but there are so many other considerations before a system really is useful for end users.
In my experience of building and selling data systems over the last decade, performance is table stakes. No one ever wants a slow system. People want a fast system that also fits real world constraints of cost, efficiency and most importantly user experience.
In this post, I wanted to lay out our views at Parseable around performance in the context of Observability. Additionally, I’ll also share with you our recent findings about ParseableDB performance on ClickBench.
Big Data, Tiny Signals
Observability is fundamentally a data problem. If you compare volumes across transactional, analytical and observability data, you’ll see that observability generates significantly more raw data than other systems. This is a widely recognized fact in the industry.
There is a key nuance here: while observability data has the highest volumes, it also has the poorest signal-to-noise ratio. Observability data yields fewer useful insights than analytical data. So if you were to think about it in a real world context,
- Transactional data is the daily bread and butter of businesses.
- Analytical data works like a vitamin – necessary for business growth and health.
- Observability data functions more like a painkiller – it helps eliminate immediate problems like downtime and inefficiency.
For businesses, in the context of observability, this combination of high volumes and poor signal-to-noise shows up as a ROI challenge. They see their costs growing with increased volumes while they might not see a direct return on their investment.
Approximately 75% of the users we spoke with in the last 6 months had cost of observability as their major concern. Even if the current costs were okay, they foresaw challenges in the near future as observability data projections showed a significant increase.
Our Journey So Far
At Parseable, our goal is to help businesses efficiently ingest observability data at scale, store it efficiently for as long as needed and make sense of this data in shortest time possible.
The first step in this journey is a purpose-built database. Here’s how we built the core database engine:
-
Compute storage separation: Unlike legacy solutions that tightly couple storage and compute, we decided to use object storage for durability and scalability. Lightweight compute nodes for real-time query execution. This means no data replication to several nodes on pricey EBS volumes.
-
Columnar storage format: ParseableDB stores data in a columnar format optimized for analytical and filter-heavy queries. This enables high compression ratios (up to 90% and average 75%) and fast query execution, minimizing the need to scan unnecessary data.
-
Indexing on demand: Instead of pre-indexing all ingested data, ParseableDB provides indexing on demand, allowing users to define indexes based on their access patterns, reducing write amplification, storage and compute overhead. You only index what you really want to search in sub seconds.
-
Stateless query nodes: We designed the query, ingest and index nodes in a way that only use local staging or caching. Object stores Parseable allows horizontal scaling without bottlenecks. Any node can serve queries independently, removing the need for complex cluster coordination.
-
Vectorized query execution: Parseable optimizes query performance using SIMD-powered vectorized execution, reducing CPU cycles needed per query and enabling sub-second responses even under load.
-
Rust based design: Rust based architecture allows up to 50% smaller compute and memory footprint.
-
Wide compatibility: We toiled through every API, how it would fit a user's workflow in terms of ingesting, querying and generally making sense of their data. We tested with OTEL logs, metrics and traces to ensure the backend scaled while compressing data - crucial for a high volume, log signal system.
We’ve seen our users reduce their costs by up to 90% with the architectural innovations making it structurally efficient.
As the adoption and then the community grew to over 1000 people across users, customers, Slack members, GitHub engagement and socials - we saw the nature of product requests change from features to performance related.
The system still needs to be fast, very fast. There is just so much data to be queried and made sense from that a slower system just can’t keep up.
So, we started our journey into performance measurement and improvement loop. The goal was to reliably quantify ParseableDB performance in the context of other OLAP systems out there.
After several CPU and memory profiling runs, many long weeks and days
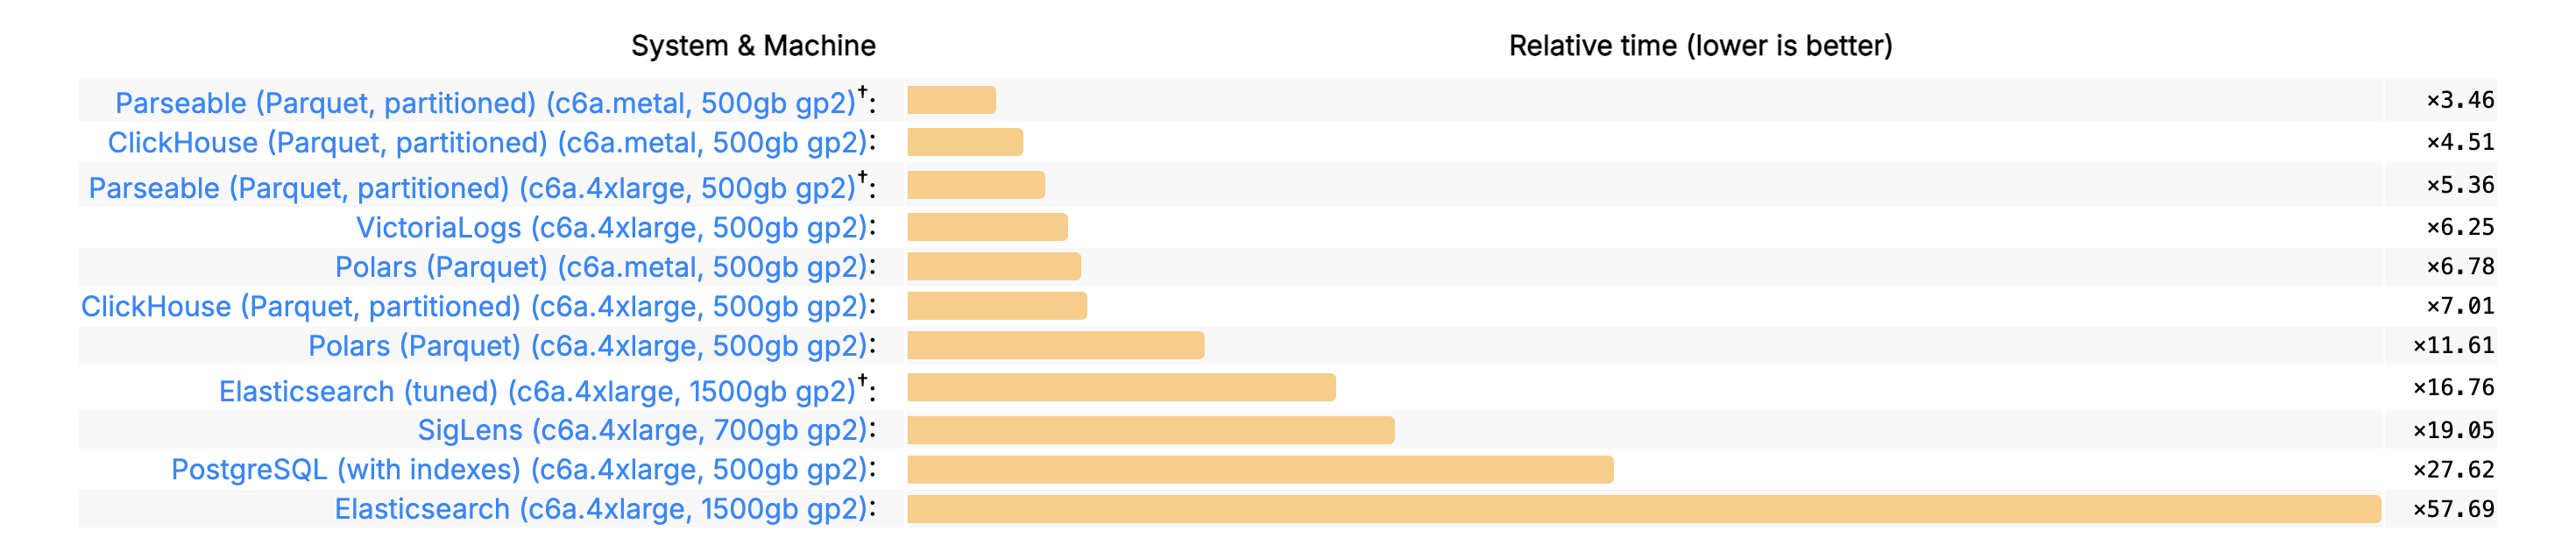
I'm proud to announce that ParseableDB now ranks among the fastest databases on ClickBench.
Run ParseableDB on ClickBench
For the technically inclined, I am listing out the high level workflow to run the benchmarks. I invite you to try this out in your own infrastructure and we’d love to hear from you on your results.
Setting up and running the benchmark is straightforward. We tested on the two most popular instance types in ClickBench ecosystem - c6a.4xlarge (16 vCPUs, 32.0 GiB) and c6a.metal (192 vCPUs, 384 GiB RAM).
Here are the high level steps:
-
Get the data
- Download the ClickBench dataset (22GB compressed).
- Extract it—this expands to a 216GB hits.json file containing 100 million rows.
-
Prepare for ingestion
- Split the file into 39,999 smaller JSON files, each with 2,500 rows (because big files slow things down).
- Convert these into proper JSON arrays so Parseable can ingest them efficiently.
-
Run the queries
- Ingest all files into Parseable (handled by ingestion.sh).
- Execute 43 analytical queries from
queries.sqlusing run_query.sh.
-
Each query runs three times:
- Cold Run: First execution with the OS page cache cleared.
- Hot Run: Average time of the next two runs, benefiting from cached data.
-
Check the results: The benchmark logs all query execution times into result.csv.
You can dig into the exact setup and scripts from the official ClickBench guide for Parseable: ClickBench Setup & Steps.
Conundrums
ClickBench is a widely used benchmark for OLAP systems, measuring query performance across multiple dimensions. It’s designed for systems that run structured queries over large datasets.
As such, ClickBench is not an ideal fit for observability workloads. I say this because the ClickBench dataset is quite small at roughly 216 GB JSON and most of the queries in the benchmark are analytical.
In an ideal observability benchmark you’d expect a much bigger dataset, at least a few TBs or so. We’ve seen mid sized organizations push up to 5 TB / day of observability data.
The performance improvement journey is far from over. We’re actively looking at other benchmarks that resemble observability workloads better. We might even split across text heavy data like logs vs numerical and time series data like metrics and measure the behavior separately.
Finding the Balance
A complicated system like observability requires a multi-dimensional thinking and balancing of several aspects. Exactly like a car where there is so much more to look at, other than raw performance.
- Observability systems are expected to run when other systems are not working well. This is especially relevant if the observability platform is running in the customer's own infrastructure.
- The whole point of observability is to be able to centralize logs from everywhere. Observability platforms should ingest a wide range of datasets with varying formats - at a very high volume. This data is semi-structured at the best.
- Post ingestion, as the requests for search and query arrive, response time and latency is important.
- Finally price remains a very important concern, along with data security and privacy. Customers not only want to ensure compliance with government regulations, complete protection of their PII inside observability data - they want to see the returns on their investments in the platform.
In Summary
Observability platforms are some of the biggest data systems. The core purpose of observability is to serve businesses by improving their reliability, up time, and helping them avoid disruptions.
Performance in such systems is table stakes. It is a given that an observability system has to be able to not only handle a wide variety of data and formats, it should also allow blazing fast responses for analytical and needle-in-haystack kinds of queries.
Observability systems also need to balance cost, privacy, and security. As data volumes continue to grow, organizations can't afford systems that force them to choose between comprehensive observability and sustainable costs. Similarly, with increased regulatory scrutiny and data sensitivity, security can't be an afterthought.
At Parseable, we've focused on creating a solution that excels across all these dimensions. Our recent ClickBench results demonstrate our commitment to performance, while our architecture decisions reflect our understanding that real-world value comes from balancing multiple critical factors.
The journey doesn't end here. As we continue to refine ParseableDB, we'll be exploring more realistic observability benchmarks and further optimizing for the unique challenges of this space.
We invite you to join us on this journey, whether by trying out Parseable, sharing your observability challenges, or contributing to our open-source project.

