Apache Superset is one of the leading visualization systems in the data analytics ecosystem. Superset can connect to any SQL-based database and has dozens of features for creating flexible and extensible visualizations.
As the boundaries between analytical events and telemetry data fades away, several of Parseable users wanted a way to deep dive into their log and event data in a single pane of glass. This is in addition to Parseable native observability focused charts and dashboards.
So we built a Parseable Superset connector based on Python SQLAlchemy toolkit. This connector serves as a bridges between Parseable API & Superset, bringing in all the observability and telemetry data in Paseable to Superset.
In this post, we’ll showcase how to setup the connect and use it to build high fidelity graphs and charts in Superset.
Setup
First step is to set up Superset on your machine. If you have a Superset instance already, you can skip to the next step.
Create a Python virtual environment
As always with Python, it’s best to use a virtual environment. Create and activate one:
python3 -m venv venvsource
venv/bin/activate  # On Linux/Mac# or
.\venv\Scripts\activate  # On Windows
Install and configure Superset
Install Apache Superset:
pip install apache-superset
Define Superset’s mandatory environment variables, the initialize the database, create an admin user and finally load initial data.
export SUPERSET_SECRET_KEY=your-secure-secret-key
export FLASK_APP=superset
superset db upgrade
superset fab create-admin
superset init
Add the Parseable connector
The Superset maintainers have merged the code for the Parseable connector, but at the time of writing, it hasn’t made it into a release. So, for now, you need to add it manually by installing it with pip:
pip install sqlalchemy-parseable==1.4
Start Superset and log in with the details provided during the setup steps:
superset run -p 8088 --with-threads --reload --debugger
Connect databases
As the Parseable API returns individual log streams, you must add each one you want to access as a different database connection, each using the same method.
-
Open the
Settingsmenu and selectData > Database connections. -
Click the
+ Databasebutton -
In the dialogue that appears, choose Other from the
Supported Databasesdrop-down. When the Parseable support makes a Superset release, it will also appear here. -
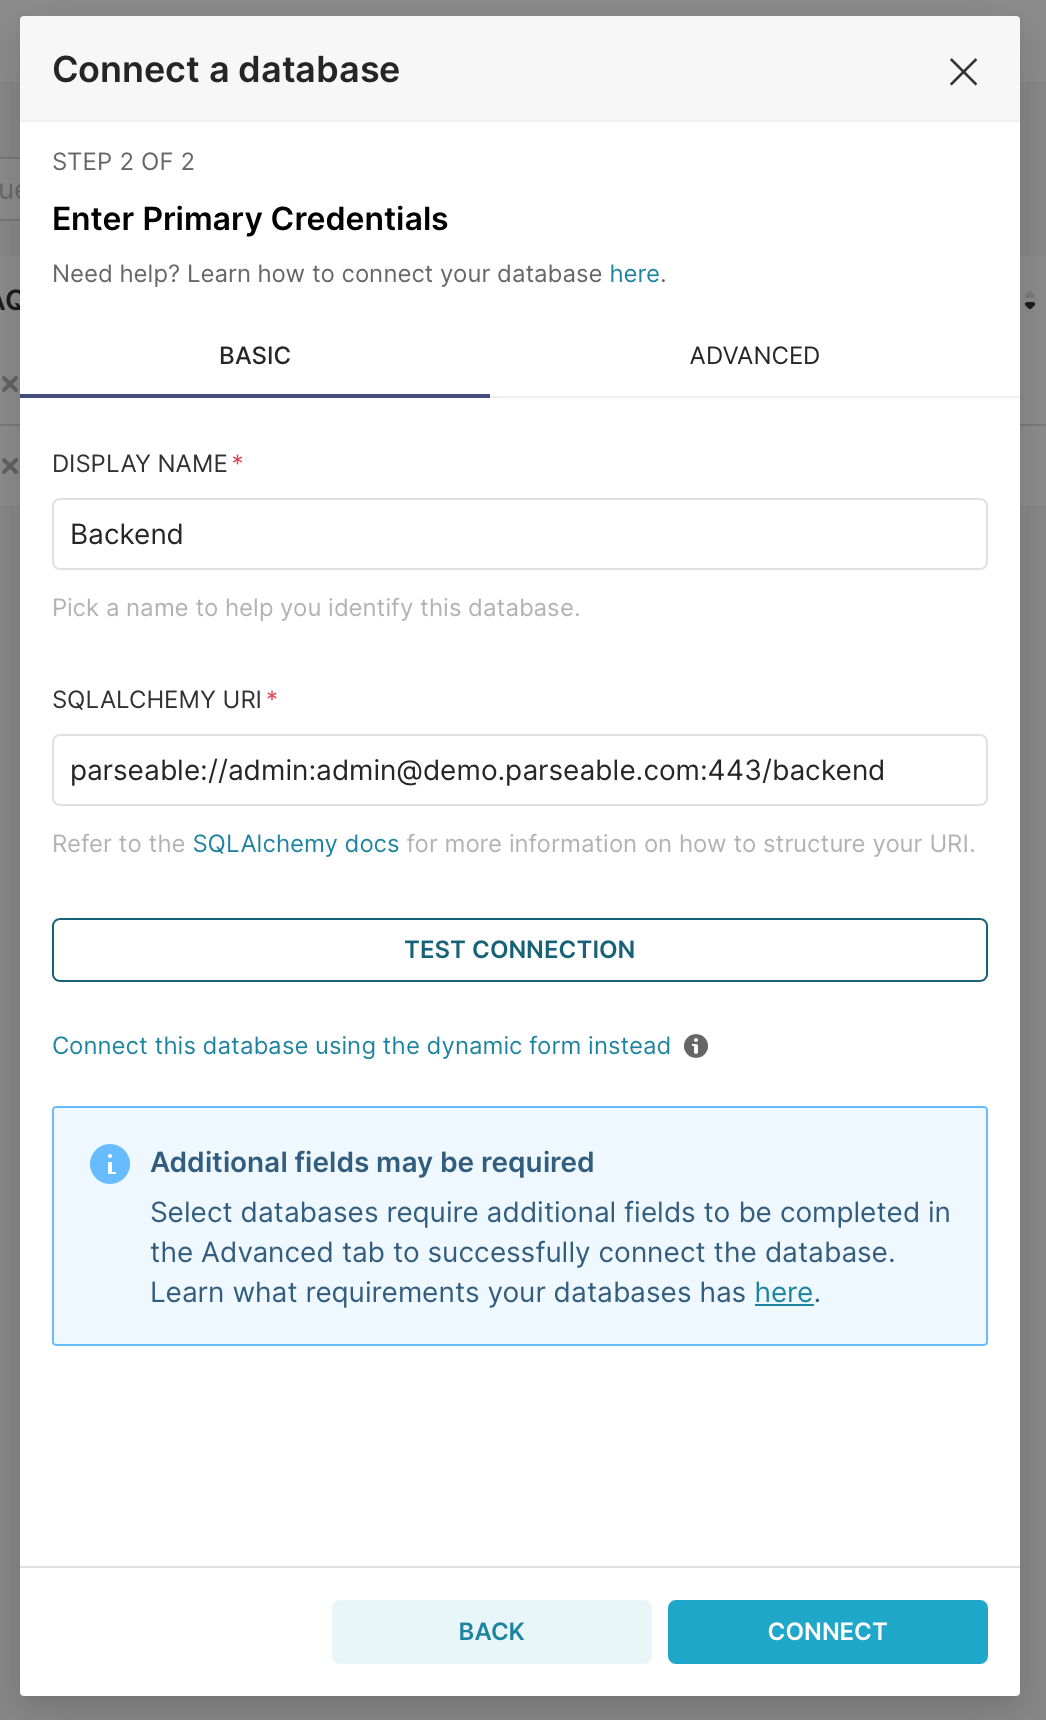
Use the SQLAlchemy URI format, which contains the protocol (parseable), the access details for the instance (this example uses the Parseable demo cluster), and most importantly, the Parseable log stream. So, for this example, add the following:
parseable://admin:admin@demo.parseable.com:443/backend -
Give the Database connection a name.
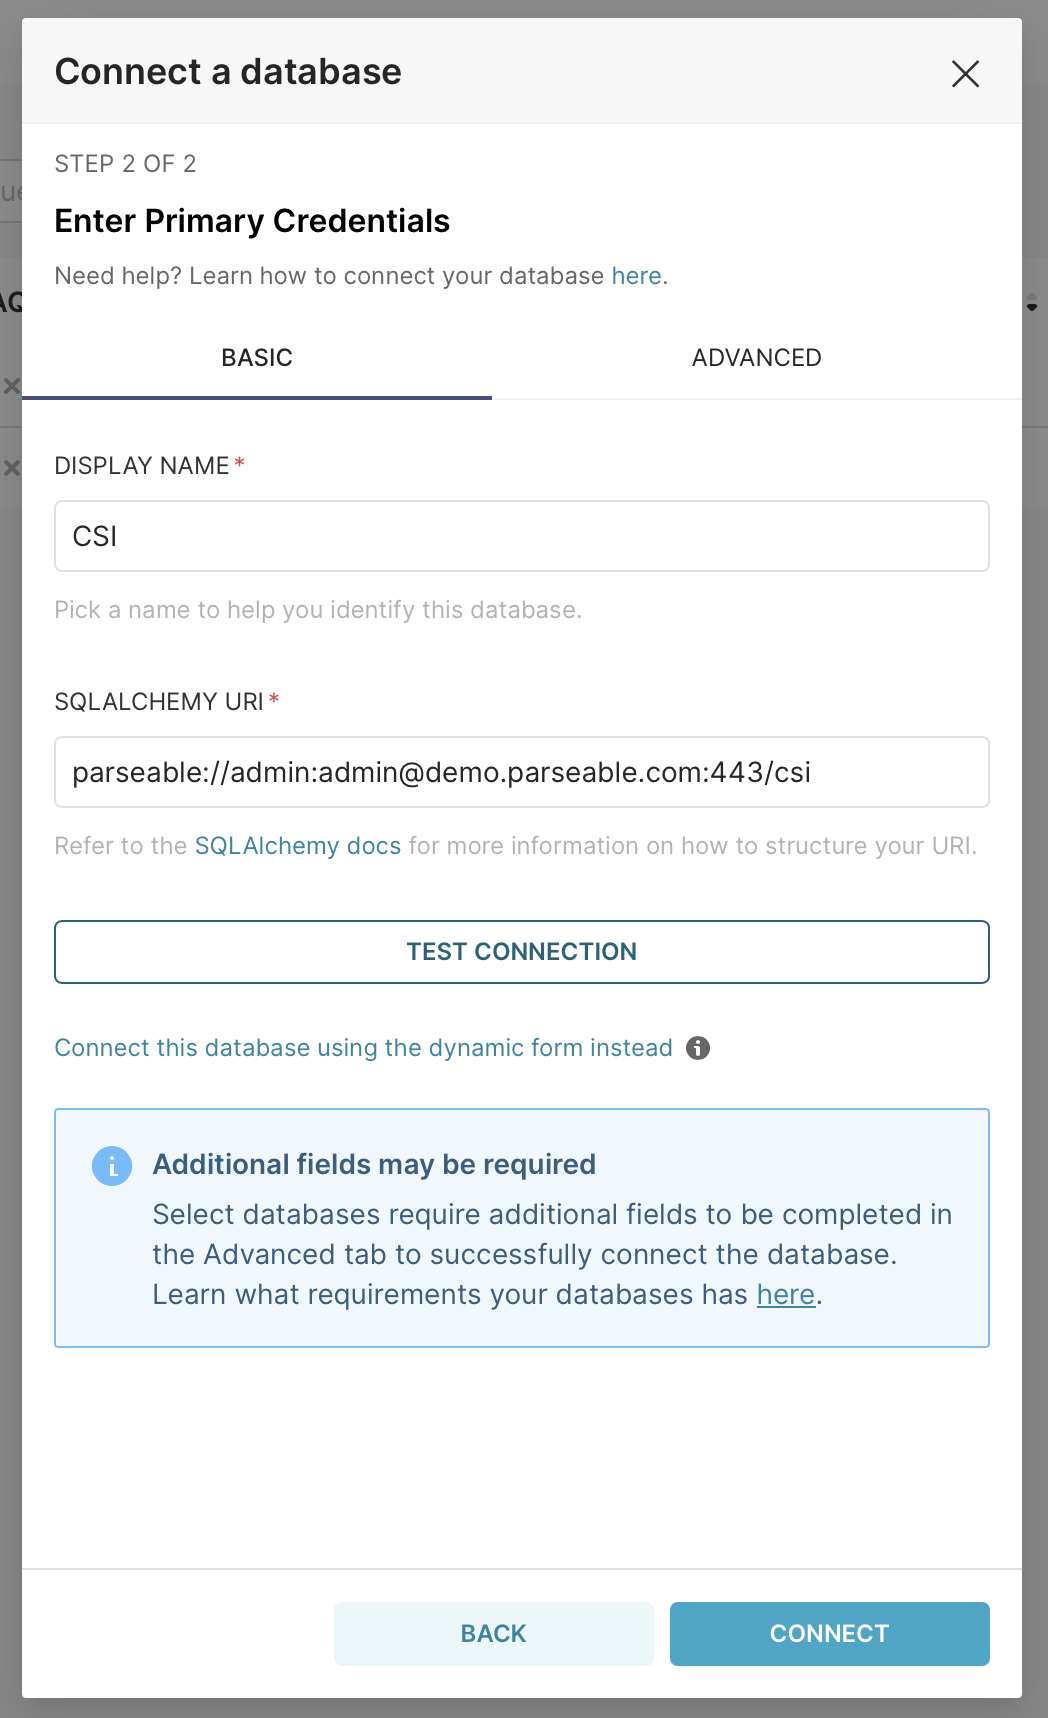
Let us also add another log stream called csi.
Create datasets and charts
As each Parseable log stream is a separate Database connection, you need to create a dataset for each database connection.
After creating a dataset, Superset takes you to the Chart creation process, so it’s easier to continue straight from there. The following instructions go through the process of creating each dataset and the related chart.
Backend operations
- Open the
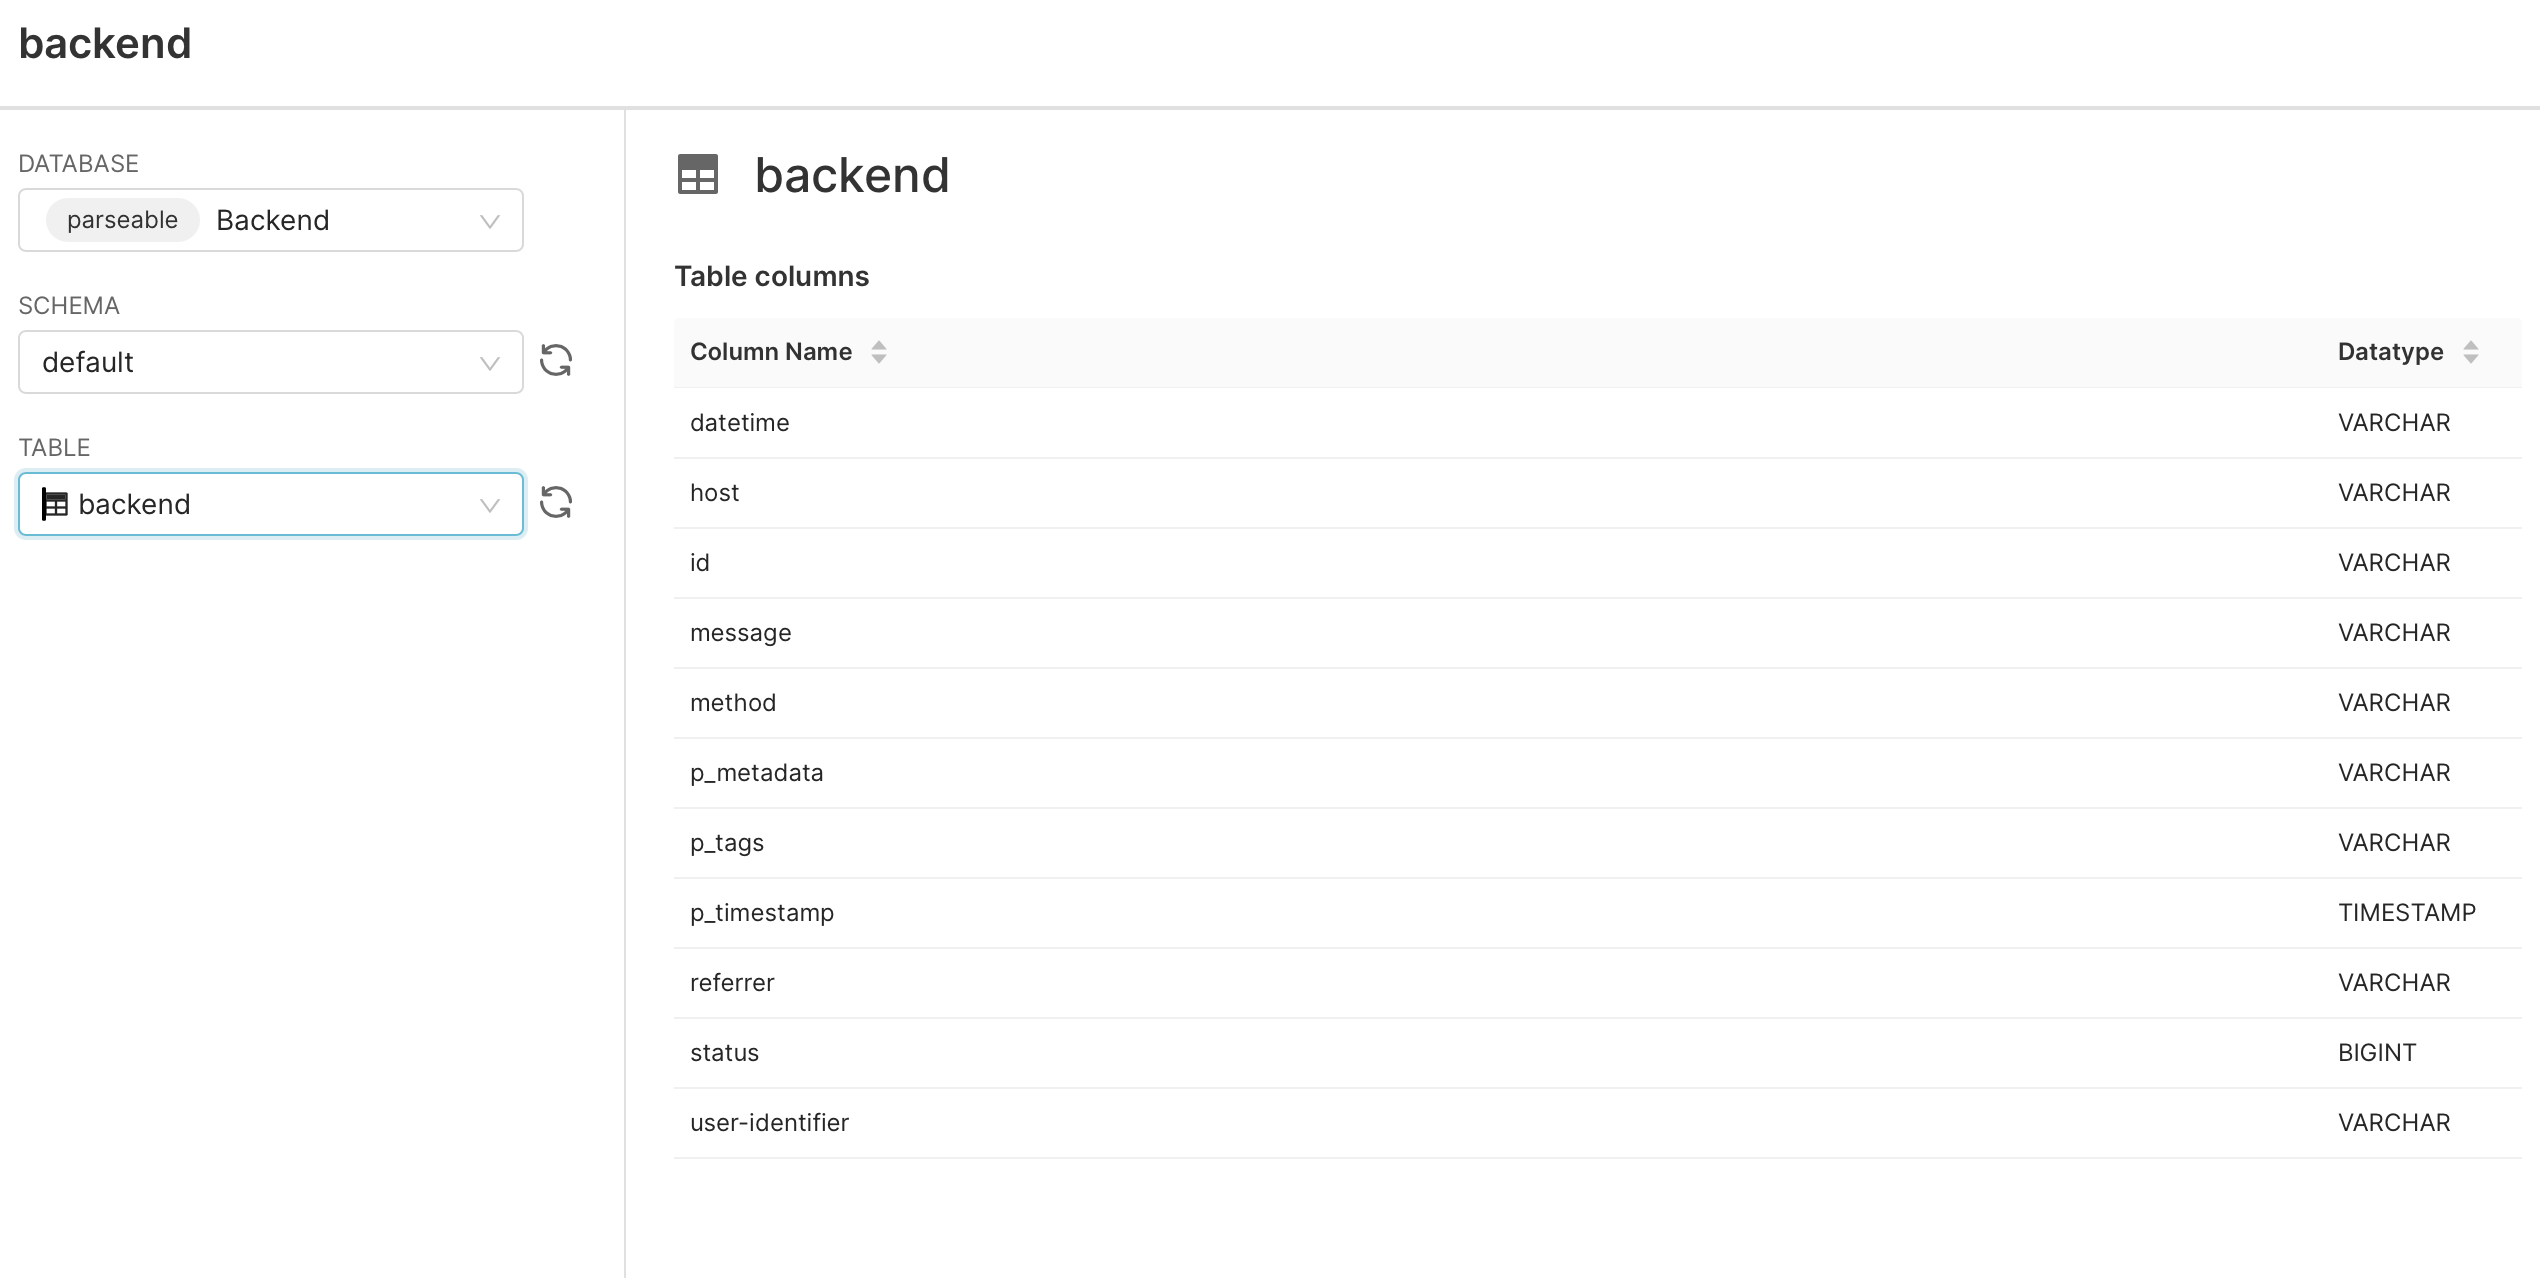
Datasetstab. - Choose
Backendas the database. - Parseable is a schema-less database, so choose “default” for the schema.
- Choose
backendfor the table. - Click
Create Dataset and Create Chart.
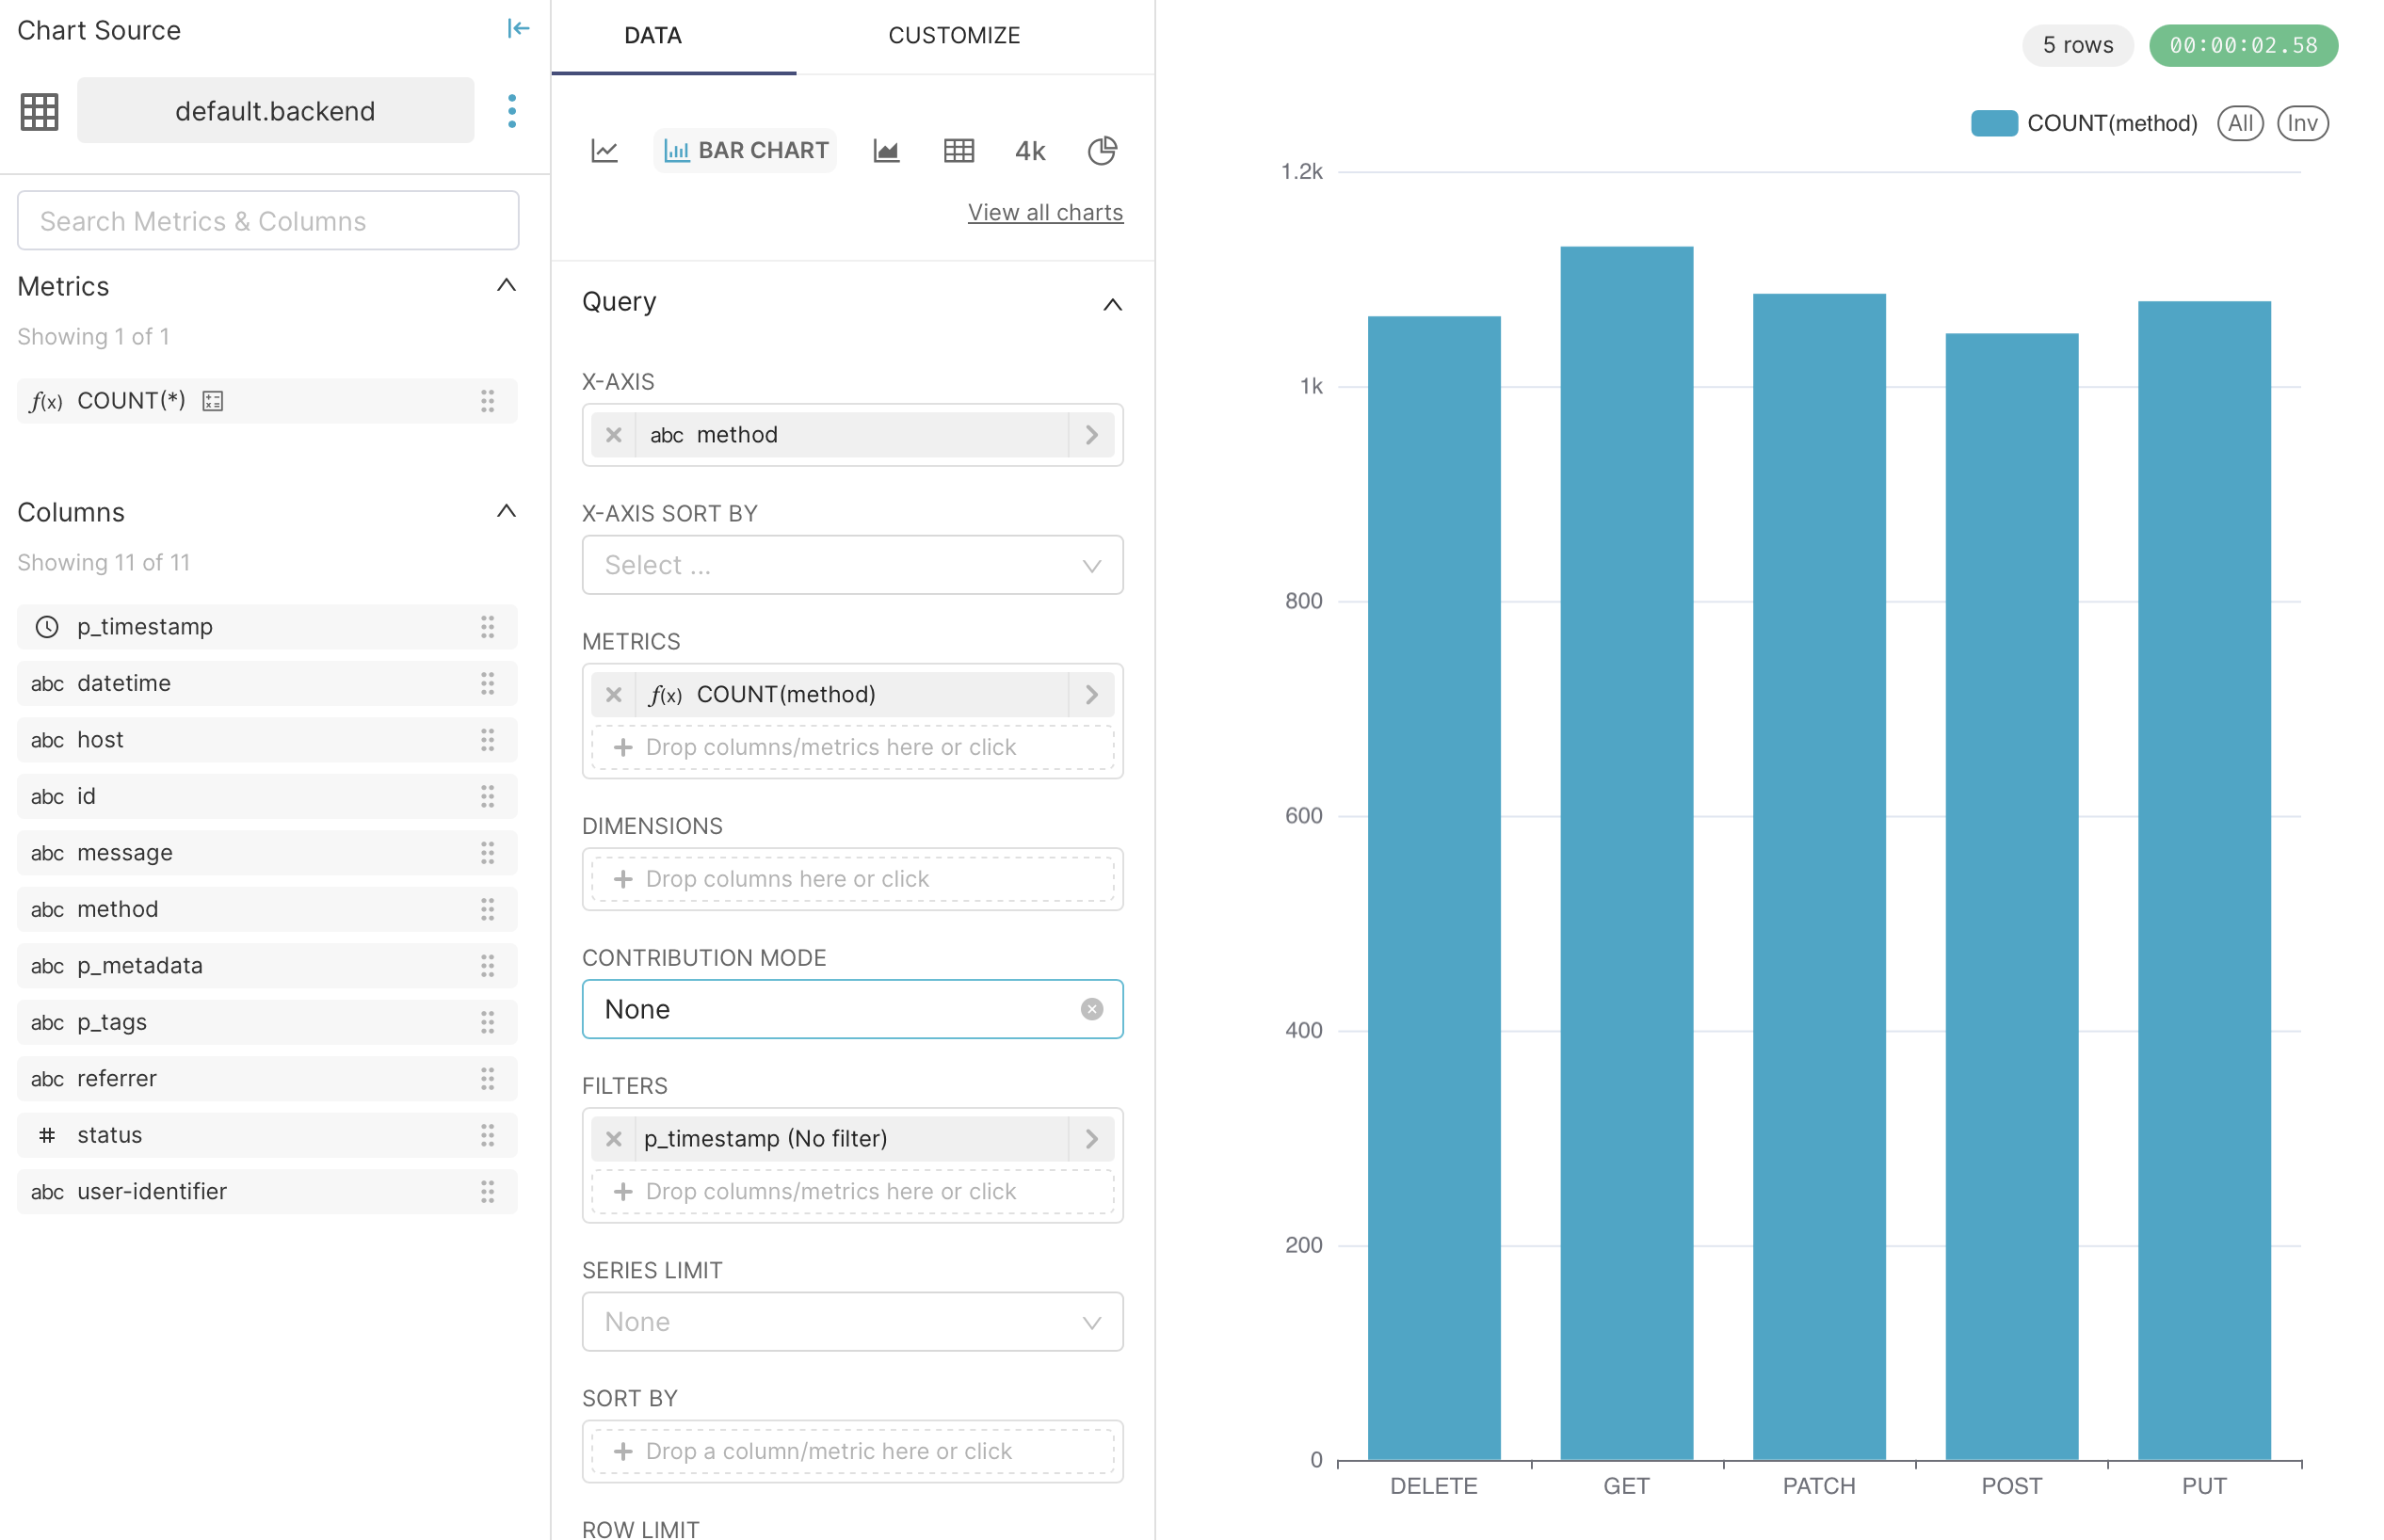
In the Charts tab, select the backend dataset, a Bar Chart chart type, and click Create New Chart.
- For the
X-axis, add themethodcolumn. - Under
Metrics, make sure to select the COUNT aggregation. Superset often defaults toCOUNT_DISTINCT, which is a useful aggregation, but it would make for an uninteresting chart in this case. - Click
Update Chartto view the resulting chart and underneath a table view of the data Superset used. - Click the
Savebutton at the top right of the window, name the chartoperations, and add it to a new dashboard namedParseable. - Click
Save and Go to Dashboard.
You should see a bar chart showing the number of different backend operations.
Error gauge
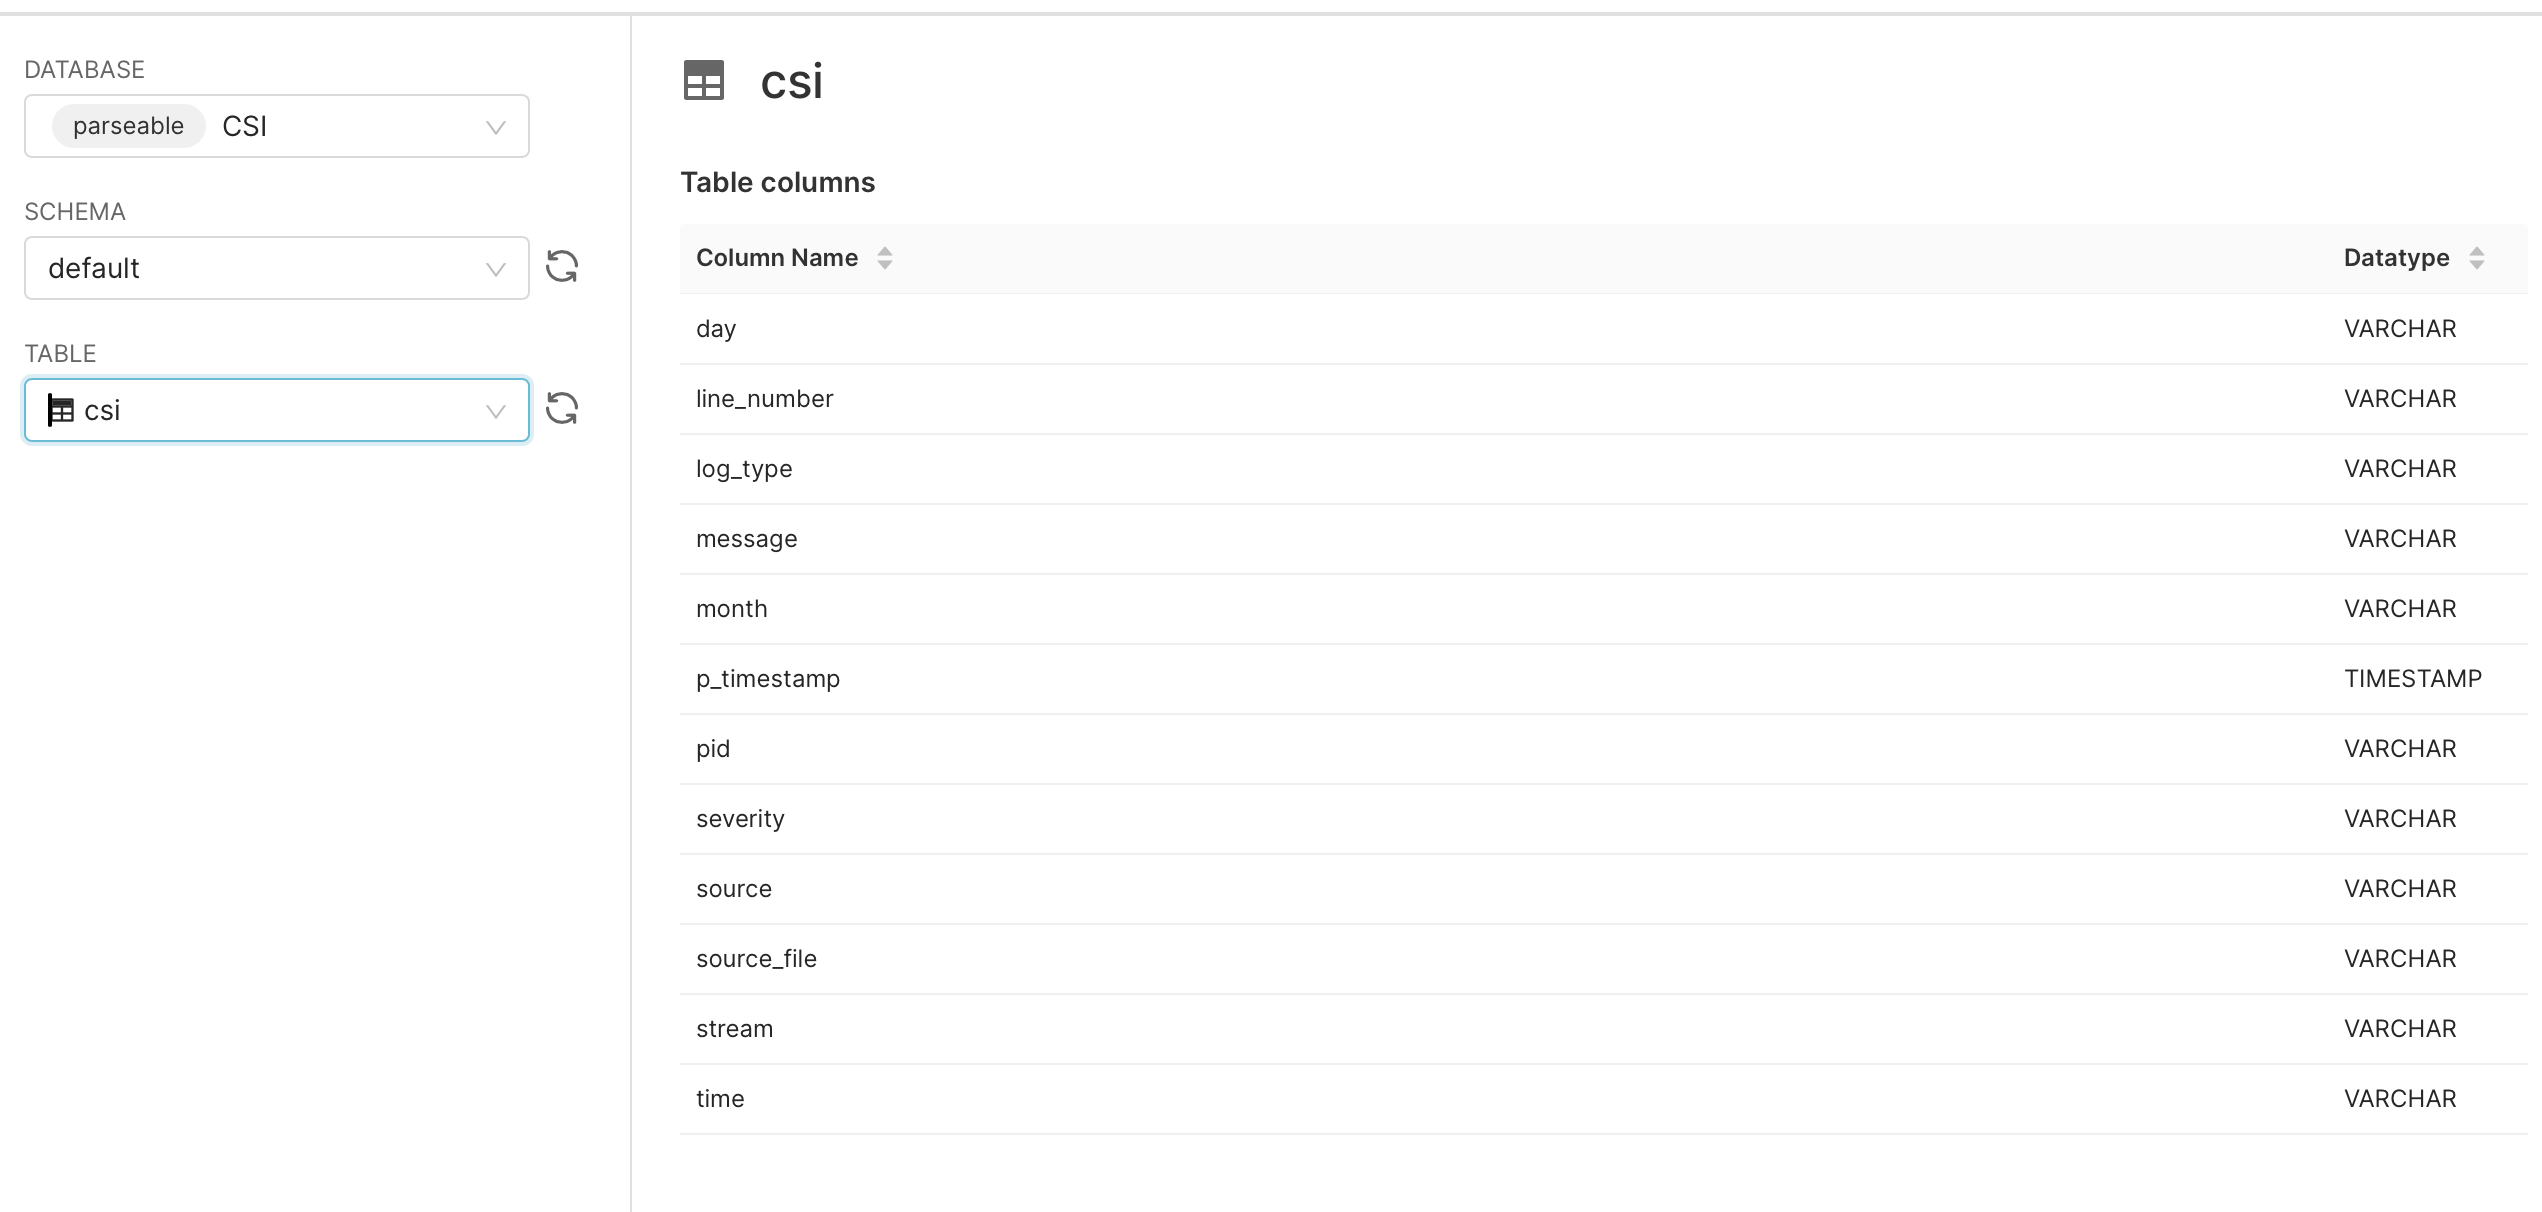
To create a dataset, follow the same steps as before, but select the CSI database and table.
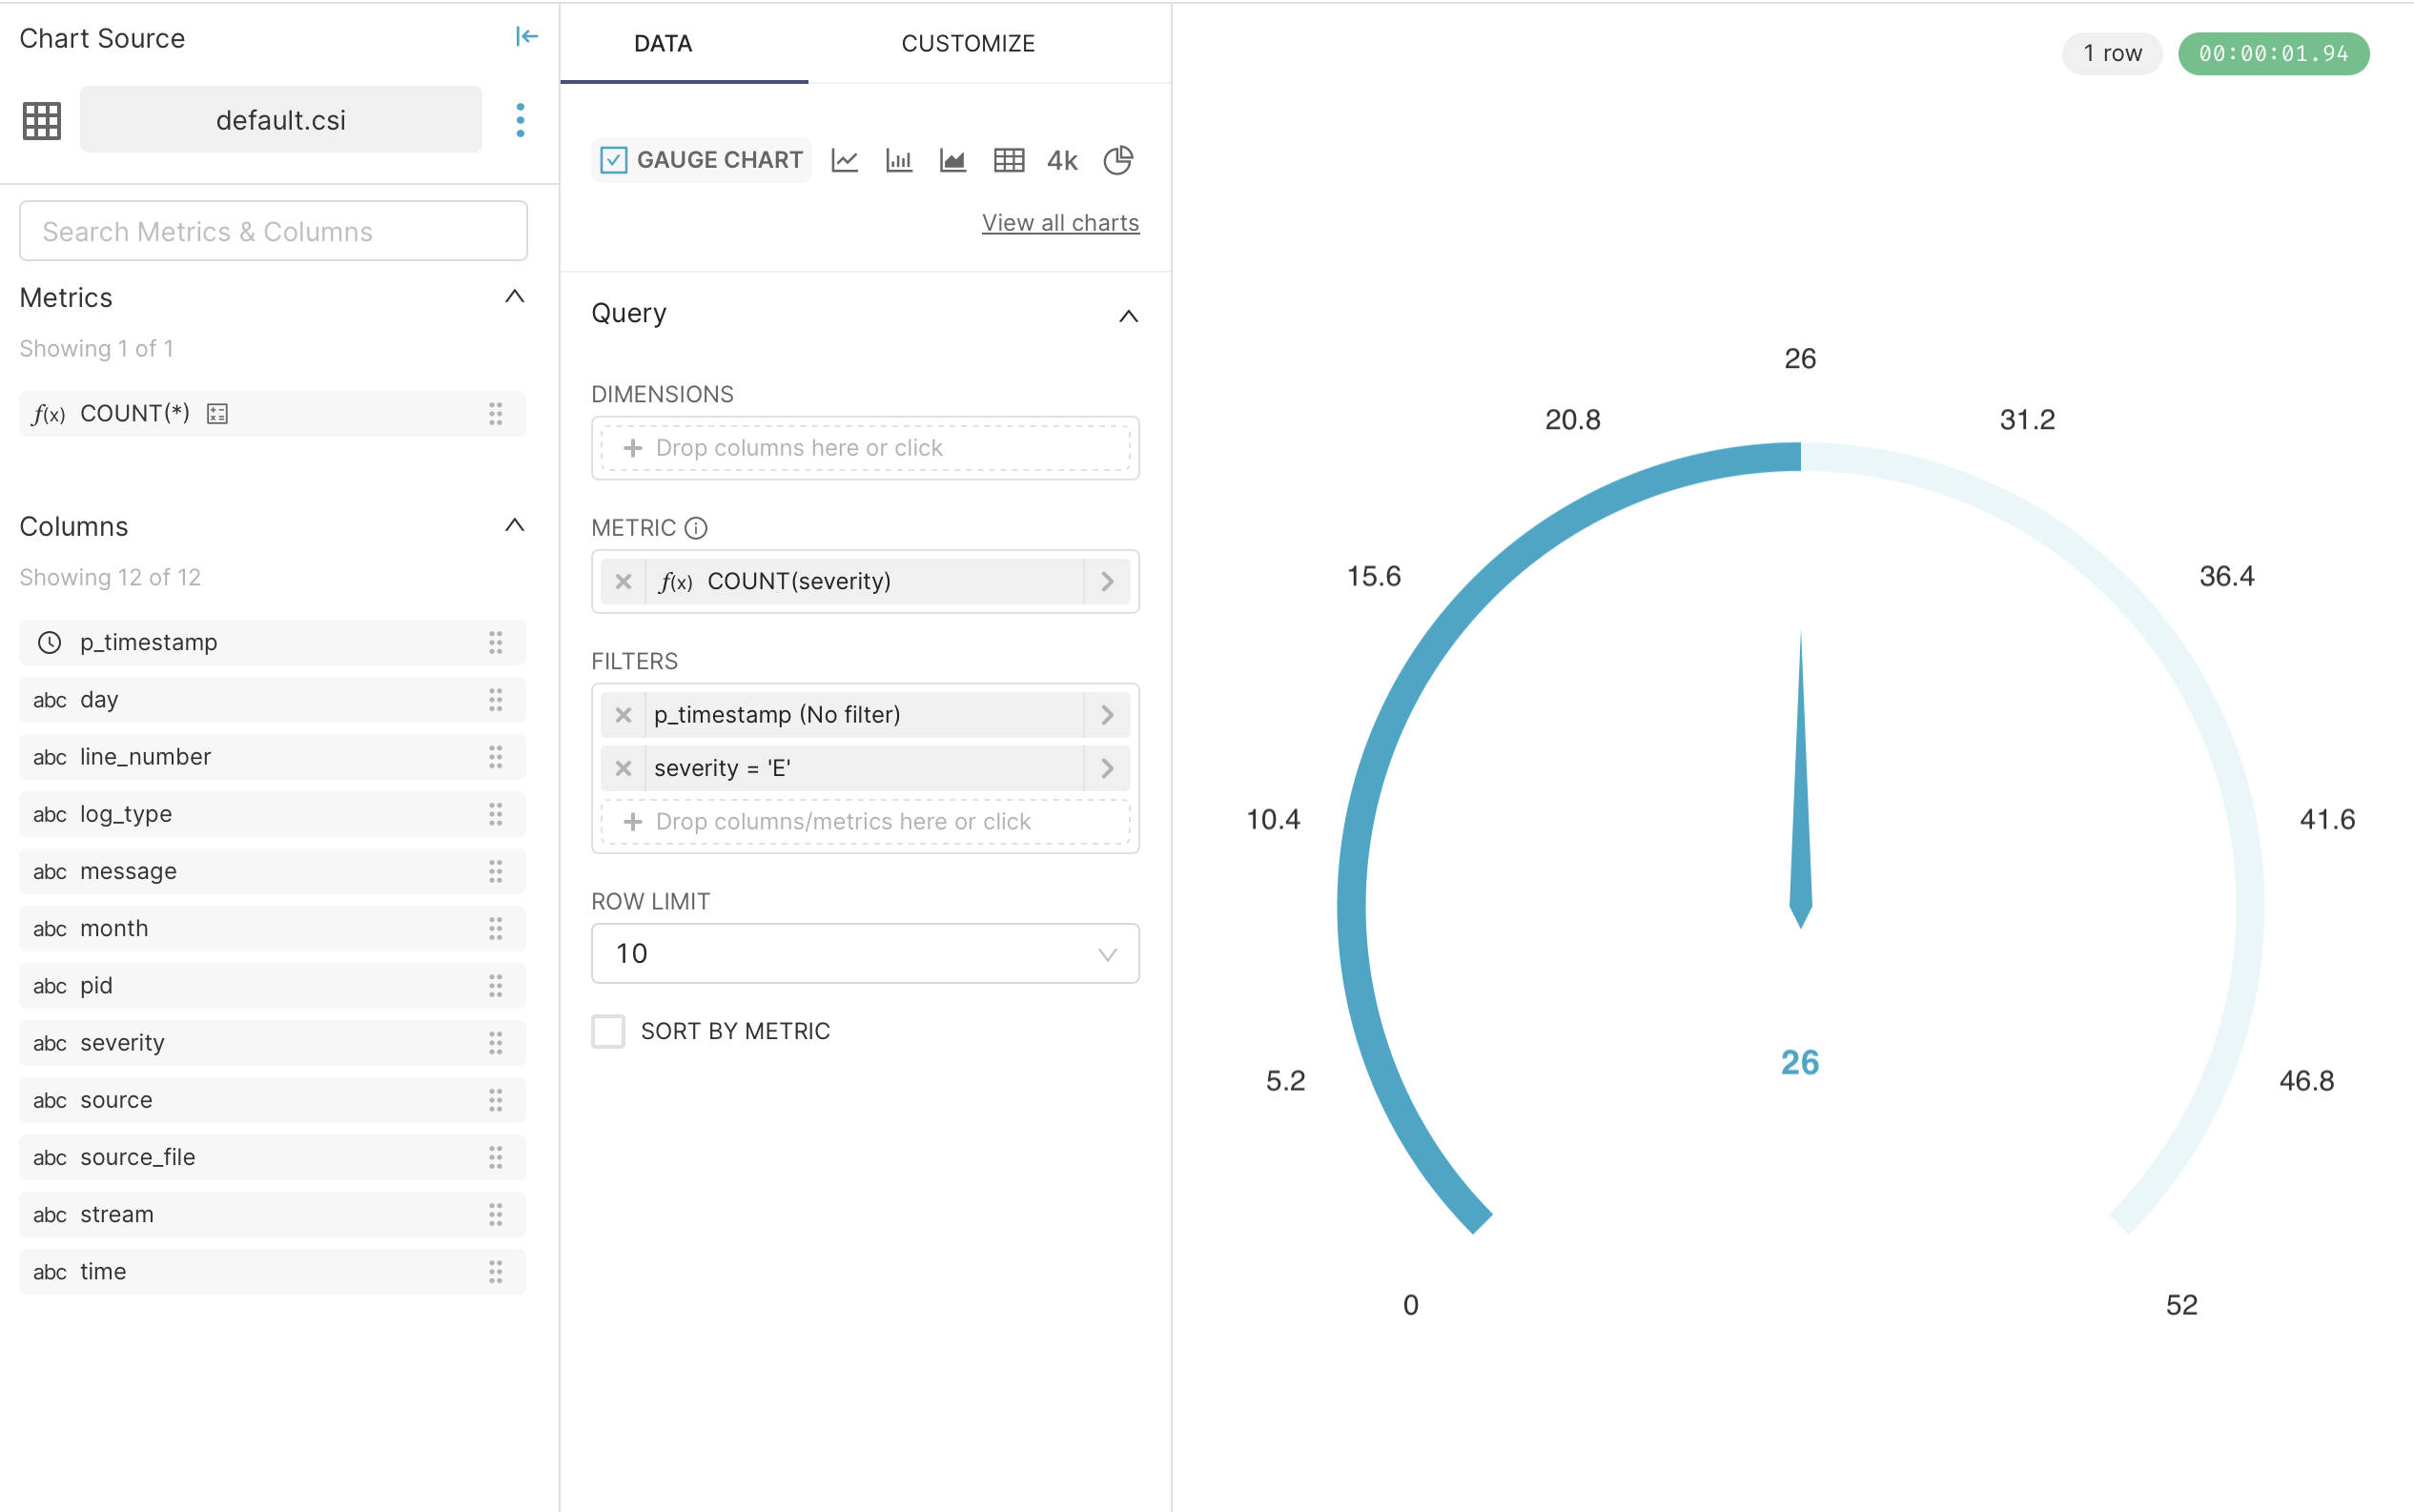
For the chart, in the Charts tab, select the csi dataset, a Gauge Chart chart type, and click Create New Chart.
- Add a second
Filter(Superset requires the timestamp filter) based on theseveritycolumn, setting it asEqual to (=)as the operator andEas the value. This means the chart only considers error severity values. - Add the
severitycolumn toMetricand the aggregation toCOUNT. - Click
Update Chartto view the resulting chart and underneath a table view of the data Superset used. - Click the
Savebutton at the top right of the screen, name the chartError rate, and add it to a new dashboard namedParseable. - Click
Save and Go to Dashboard.
You should see a gauge showing the current error rate. For the log stream in the Parseable demo cluster, this is about 50%.
Query log streams with SQL
You can also use Superset to query Parseable log streams, but it requires an extra step when you create the database connection.
-
Open the
Settingsmenu and selectData > Database connections. -
Click the
+ Databasebutton -
In the dialogue that appears, choose
Otherfrom theSupported Databasesdrop-down. -
Add the following SQLAlchemy URI:
parseable://admin:admin@demo.parseable.com:443/ingress-nginx -
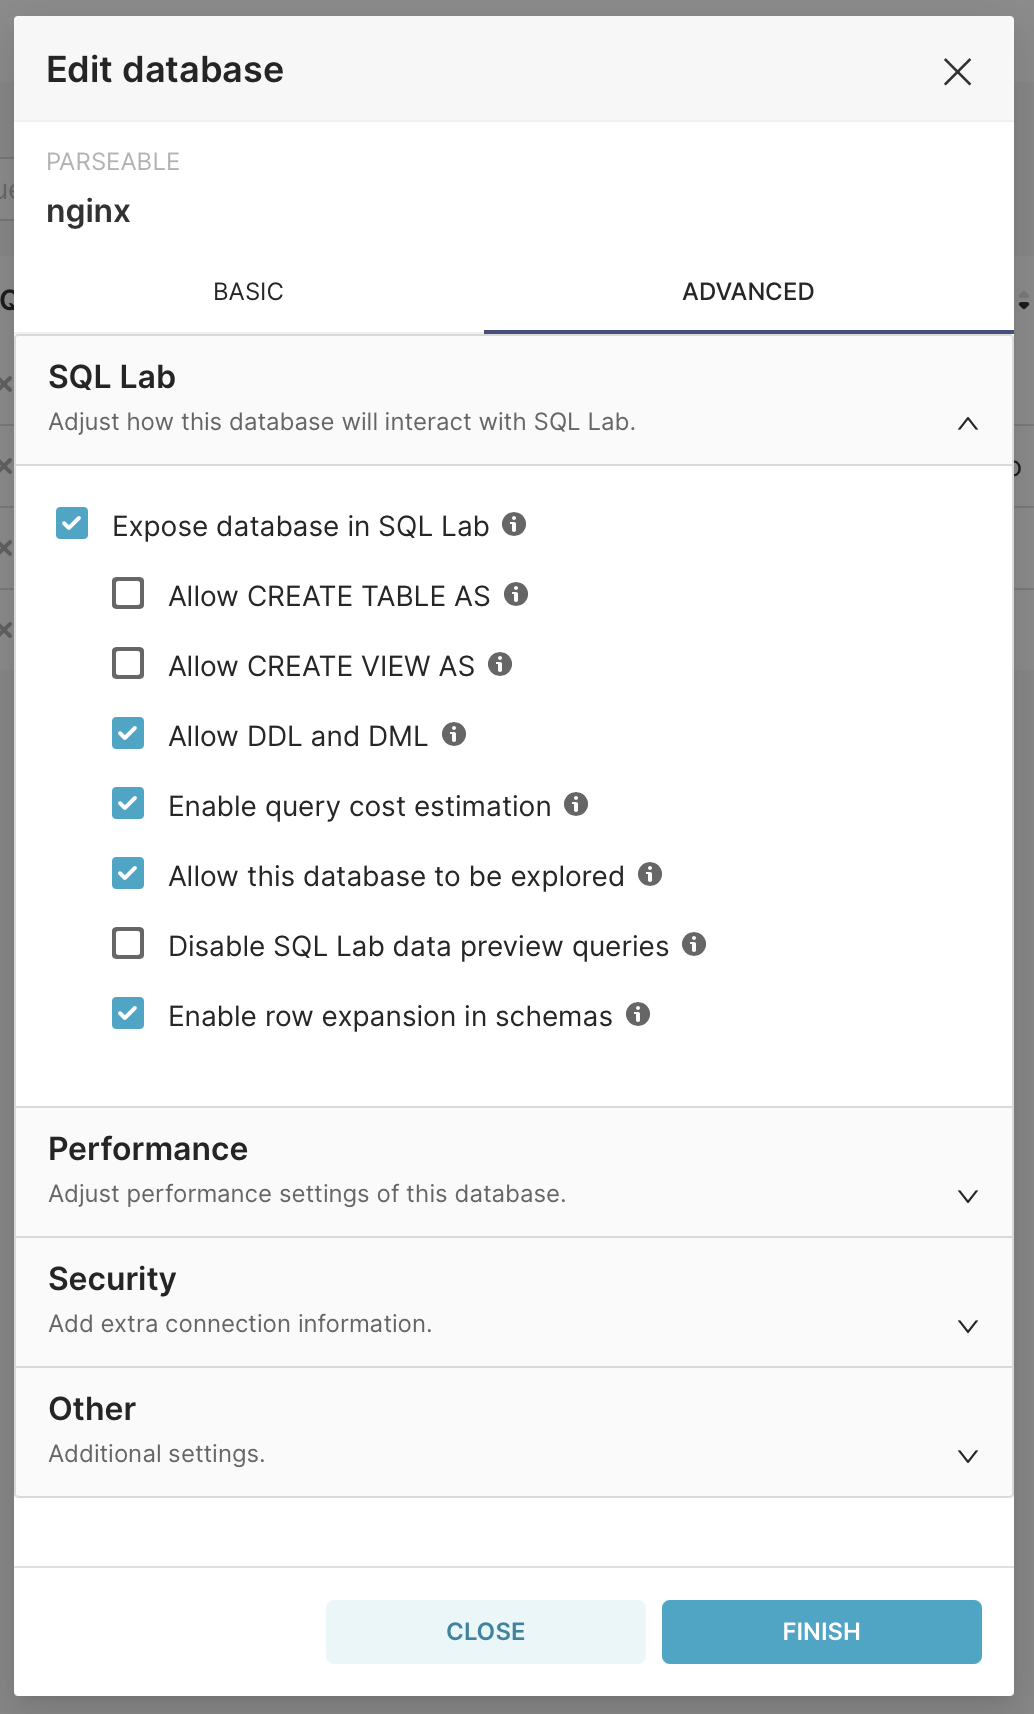
Click the
Advancedtab and expandSQL Lab. Make sure the following items are checked:- Allow DDL and DML
- Enable query cost estimation
- Allow this database to be explored
- Enable row expansion in schemas
-
Click
Finish.
To query the database, open the SQL > SQL Lab tab. Select the nginx database and its schema and table schema, then try the following queries.
SELECT status, COUNT(*) as count
    FROM ingress-nginx
    WHERE p_timestamp >= '2024-01-01T00:00:00Z'
    GROUP BY status;
Shows the groupings of status messages after a particular time.
SELECT method, status, COUNT(*) as count
FROM ingress-nginx
WHERE p_timestamp >= '2024-01-01T00:00:00Z'
GROUP BY method, status;
Queries and returns methods and statuses after a certain time.
Summary
This article looked at how to add Parseable log streams to Apache Superset and use its powerful tools to create visualizations and queries of your log data. Using these steps and techniques, you can bring Parseable data into a suite of other tools and cross-query it with other sources in your stack to get rich insights into your data.