Grafana is one of the most recognized names in observability, but in most deployments it is only the dashboard layer. Behind it sits a collection of backends that each need to be deployed, scaled, and operated: Prometheus for metrics, Loki for logs, Tempo for traces, and Mimir if you need long-term metric storage at scale. Every backend speaks a different query language. Every backend adds operational surface area. Every backend adds cost.
Teams searching for Grafana alternatives are not abandoning observability. They are looking for platforms that handle more signals in fewer systems, let engineers query data without memorizing three different query dialects, and scale without producing cost surprises at the end of the month.
This guide covers the 10 strongest Grafana alternatives available in 2026. Whether you are choosing an observability stack for the first time, running an SRE team that is tired of juggling the LGTM stack, or an enterprise evaluating total cost of ownership, there is a Grafana alternative in this list that matches your situation.
Why teams look for Grafana alternatives
The teams most actively evaluating Grafana alternatives today tend to share a common set of frustrations: a stack that has grown harder to operate than the problems it solves, query languages that slow down incident response, and a per-series pricing model that quietly compounds as Kubernetes workloads scale.
-
Stack fragmentation drives operational overhead: A standard Grafana-based deployment requires four or five separate systems. Prometheus scrapes and stores metrics. Loki ingests and indexes logs. Tempo handles distributed traces. Mimir provides long-term metric storage. Each has its own configuration, scaling behavior, storage backend, and query language: PromQL for metrics, LogQL for logs, TraceQL for traces. During an incident that crosses signal boundaries, engineers context-switch between systems and query dialects, losing time exactly when time matters most.
-
Pricing at scale is unpredictable: Grafana Cloud's Pro tier charges $6.50 per thousand active metric series above the free allowance and $0.50 per GB for logs and traces. For Kubernetes-native workloads, where metric cardinality multiplies with every new pod, label, or namespace, the metric bill climbs fast. This is one of the primary cost drivers pushing teams toward Grafana alternatives with simpler, per-GB pricing.
-
Unified observability is now the expectation: Modern Grafana alternatives ship logs, metrics, and traces in a single interface with cross-signal correlation on a shared timeline. Engineers who have worked on unified platforms consistently resist returning to siloed backends where a single investigation requires three tools.
-
Query complexity slows incident response: During a high-pressure incident, the last thing an SRE needs is to remember which tool holds which signal and which query syntax to use. Grafana alternatives that support SQL querying, natural language search, or simpler query builders reduce cognitive load at the worst possible moments.
What to look for in Grafana alternatives
The best Grafana alternatives share a common set of traits, but which ones matter most depends on your team's specific pain points. Before evaluating platforms, identify which of these dimensions are non-negotiable:
- Unified signal coverage -- Does the platform handle logs, metrics, and traces without requiring separate backends?
- OpenTelemetry support -- Is OTLP ingestion a first-class concern or a bolted-on addition?
- Query experience -- Can engineers outside of SRE query the platform effectively, especially under pressure?
- Deployment flexibility -- Self-hosted, BYOC, managed cloud, or all three?
- Cost predictability at scale -- Does pricing correlate with data volume, or does it spike with metric cardinality?
- Alerting and anomaly detection -- Proactive detection, or threshold-only alerting?
- Ecosystem breadth -- Does it connect to your existing stack without custom pipelines?
Grafana Alternatives at a Glance
Before diving into individual tools, this comparison table shows how the leading Grafana alternatives stack up across the dimensions that matter most to buyers.
| Tool | Best for | Unified logs, metrics, traces | OpenTelemetry | Self-hosted / BYOC | Query experience | Pricing model | Main trade-off |
|---|---|---|---|---|---|---|---|
| Parseable | Unified observability at lower cost | Yes | Native | Both | SQL + plain English | $0.39/GB (Pro) | Newer ecosystem |
| SigNoz | Open-source, OTel-first teams | Yes | Native | Both | Custom UI + PromQL | $0.30/GB logs/traces | Smaller enterprise feature set |
| Datadog | Full-stack managed observability | Yes | Supported | No | APM + query builder | $15+/host + per GB | Very expensive at scale |
| New Relic | Consumption-based pricing simplicity | Yes | Supported | No | NRQL + AI assistant | $0.40/GB beyond 100GB free | No self-hosting |
| Dynatrace | AI-driven enterprise observability | Yes | Supported | Limited | DQL (proprietary) | $29-$58/host/month | Vendor lock-in |
| OpenObserve | Low-cost ingestion, cost reduction | Yes | Supported | Both | SQL + PromQL + VRL | $0.50/GB cloud | Smaller community |
| Elastic | Search-heavy log workloads | Partial | Supported | Both | KQL + ES|QL | Serverless or hosted | Operational complexity |
| VictoriaMetrics | Prometheus-compatible backend at scale | Metrics + logs | Compatible | Both | MetricsQL + LogsQL | Open source / Enterprise | No native dashboards |
| Better Stack | Uptime + unified telemetry | Yes | Native | No | SQL + PromQL | From $25/month bundle | No self-hosting |
| Splunk | Enterprise SIEM and compliance | Yes | Supported | Both | SPL | Custom (contact sales) | Very expensive |
10 Best Grafana Alternatives in 2026
1. Parseable: Best Grafana Alternative for Unified Observability at Lower Cost
If you are running the LGTM stack today and spending a meaningful share of your engineering budget keeping backends operational instead of building product, Parseable is the Grafana alternative built directly for that problem.
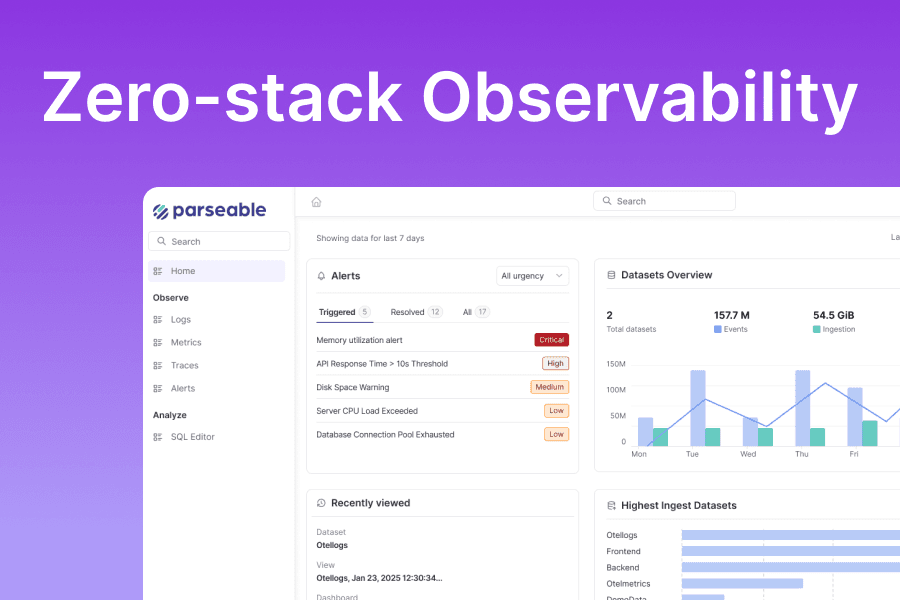
Parseable is an AI-native unified observability platform that stores logs, metrics, and traces in Apache Parquet format on S3-compatible object storage. Instead of maintaining separate backends for each signal type, your entire telemetry estate lands in one system, queryable through SQL or plain English. There is no JVM to tune, no shard management to worry about, and no multi-backend alerting configuration to keep synchronized.
Why it stands out as a Grafana alternative
The core architectural difference between Parseable and a Grafana-based stack is where the complexity lives. The LGTM stack distributes complexity across backends, each with its own operational model, retention configuration, and query syntax. Parseable consolidates it. Object-store economics, specifically S3 at around $0.023/GB/month, replace Grafana Cloud's per-series and per-GB charges, making storage costs significantly more predictable at production scale. For teams doing the math on Grafana alternatives, that unit cost difference compounds fast at anything above 50GB/day of telemetry.
OpenTelemetry-native ingestion accepts OTLP over HTTP, which means any application already instrumented with OTel SDKs connects without an intermediary pipeline. Teams that have adopted OpenTelemetry as their instrumentation standard get full signal coverage the moment they point the OTel Collector at Parseable.
Querying without the friction
One of the most practical differentiators for teams evaluating Grafana alternatives is the query experience. PromQL, LogQL, and TraceQL each require engineers to internalize a separate syntax. Parseable offers SQL as the primary query interface already familiar to most engineering and data teams, and extends it with plain-English AI-powered querying for even lower friction during incidents. When a trace anomaly needs to be correlated against a log spike and an infrastructure metric, an engineer should not need to remember three different tools and three different syntaxes to do it.
AI-native workflows
Parseable's anomaly detection uses forecasting models to surface unusual patterns before they become customer-facing incidents, rather than waiting for a static threshold to breach. The platform extends this to cover LLM and agent observability, making it useful for teams shipping AI-powered products who need to track token usage, latency distributions, and error rates alongside infrastructure signals. The integrations catalog includes LangChain, OpenAI, Anthropic, LlamaIndex, CrewAI, and several other AI frameworks alongside more than 50 traditional infrastructure integrations.
Deployment flexibility and data ownership
Parseable runs on Parseable Cloud, in your own cloud account via BYOC, or fully self-hosted on your own infrastructure. For teams with data residency requirements under GDPR or HIPAA, the Enterprise plan keeps data inside your own S3 bucket within your VPC. No telemetry leaves your infrastructure. This is a meaningful distinction from SaaS-only vendors where all data flows through a shared multi-tenant pipeline, and it is one of the reasons Parseable resonates with teams looking for Grafana alternatives that offer genuine data ownership.
Pricing
The Pro plan is $0.39/GB ingested, includes 365 days of data retention, unlimited users, dashboards, alerts, and AI-native analysis, with a 14-day free trial. The Enterprise plan starts at $15,000/year and adds BYOC, self-hosted deployment, Apache Iceberg support, 24/7 premium support with one-hour SLA for critical issues, and dedicated infrastructure. The open-source tier is free with community support. See the full breakdown on the Parseable pricing page.
Compared to Grafana Cloud's $6.50 per thousand active metric series plus $0.50/GB for logs, and the additional operational cost of running Prometheus, Loki, Tempo, and Mimir backends, Parseable's all-in per-GB pricing is considerably more predictable at production scale.
2. SigNoz: Open-Source Grafana Alternative for OpenTelemetry-First Teams
SigNoz is an open-source observability platform built from the ground up for OpenTelemetry, and it is one of the strongest Grafana alternatives for teams that want a single interface covering logs, metrics, and traces without operating the LGTM stack's fragmented backends.
Built on ClickHouse as its columnar storage engine, SigNoz handles all three observability signals with correlations across signal types. It is one of the few Grafana alternatives where OpenTelemetry is not a retrofit but an architectural foundation, which means trace-to-log and log-to-metric correlations work reliably rather than relying on brittle label matching.
Best for: Engineering teams that want an open-source Grafana alternative, prefer self-hosting or BYOC, and have already adopted OpenTelemetry instrumentation. Also a strong fit for startups that want Datadog-level visibility without per-host fees.
Pricing
- Community (self-hosted): Free
- Teams Cloud: $49/month base, then $0.30/GB for logs and traces, $0.10/million metric samples
- Enterprise: Starts at $4,000/month; BYOC, self-hosted, and dedicated cloud options
- Startup program: 50% discount for companies under 3 years old with fewer than 30 employees
Pros
- Genuinely open-source and self-hostable at no cost
- OpenTelemetry-native architecture with full semantic convention support
- ClickHouse backend delivers fast columnar queries across large datasets
- No per-host or per-node pricing
- SOC2 Type II and HIPAA compliant on cloud plans
- Clean correlation between traces, logs, and metrics in a single UI
Cons
- Advanced enterprise features require paid plans
- Smaller plugin and integration ecosystem than Grafana
- Self-hosted ClickHouse management adds operational overhead
- Less mature than established commercial platforms for edge-case enterprise requirements
3. Datadog
Datadog is one of the most capable Grafana alternatives for teams that want to eliminate backend fragmentation entirely and have the budget to match. It covers infrastructure monitoring, APM, log management, distributed tracing, synthetic monitoring, security, and more under a single managed platform.
Best for: Mid-to-large engineering teams that want a fully managed platform with rich out-of-the-box dashboards, deep integrations, and are willing to pay a premium for reduced operational overhead.
Pricing
- Infrastructure Pro: $15/host/month (annual)
- Infrastructure Enterprise: $23/host/month (annual)
- APM: $31/host/month with infrastructure
- Log ingest: $0.10/GB; Standard indexing: $1.70/million log events
- No self-hosted or BYOC option
Pros
- Most comprehensive integration and pre-built dashboard catalog available
- Excellent APM with distributed tracing and continuous profiling
- AI-powered alert investigation and root-cause analysis
- Strong compliance posture: SOC2, HIPAA, FedRAMP
- Deep Kubernetes visibility with automatic service discovery
Cons
- Pricing scales aggressively; bill surprises are common in fast-growing environments
- No self-hosted or BYOC option
- Per-host pricing penalizes high-cardinality Kubernetes workloads
- Log indexing costs compound quickly on high-volume pipelines
- Proprietary agents and query language create vendor dependency
If Datadog's cost at scale is the issue, Parseable delivers comparable unified observability at a fraction of the per-GB cost, with a self-hosted or BYOC option for teams that need data residency.
4. New Relic: Grafana Alternative for Consumption-Based Pricing Simplicity
New Relic is a strong Grafana alternative for teams whose primary frustration is unpredictable per-host pricing. It rebuilt its platform around consumption rather than host count. You pay for data ingested and users with full platform access, not for the number of servers or containers you run. The 100GB/month free tier makes it one of the easiest full observability platforms to evaluate without upfront commitment.
Best for: Teams that want a fully managed Grafana alternative with transparent, consumption-based pricing and no host-based fees. Also a fit for small teams whose workload fits inside the generous free tier.
Pricing
- Free: 100GB/month ingest, 1 full platform user, unlimited basic users
- Data ingest: $0.40/GB (original) or $0.60/GB (Data Plus) beyond 100GB
- Full platform users: $349/user/month (Pro annual), $99/user/month (Standard, max 5 users)
- No self-hosted or BYOC option
Pros
- Consumption-based pricing avoids host-count inflation in Kubernetes environments
- 100GB/month free tier covers many small team use cases
- AI-powered NRQL query assistant lowers friction
- Full observability signal coverage in a single managed platform
- No credit card required to start
Cons
- No self-hosted or BYOC option; all data flows through New Relic's infrastructure
- Full platform user pricing is expensive at team scale
- HIPAA and FedRAMP require the more expensive Data Plus tier
- EU data center adds cost per GB/month
- Proprietary NRQL query language requires learning
5. Dynatrace: Grafana Alternative for AI-Driven Enterprise Observability
Dynatrace takes a fundamentally different approach from most Grafana alternatives in this list. Its Davis AI engine discovers application dependencies automatically through OneAgent instrumentation and continuously analyzes the full application topology. Rather than requiring engineers to build dashboards and configure alerts manually, Dynatrace surfaces problems proactively with root-cause analysis already attached.
Best for: Large enterprises with complex hybrid environments that mix legacy applications and modern Kubernetes workloads, and that need AI-driven anomaly detection without manual alert configuration overhead.
Pricing
- Infrastructure Monitoring: $29/month per host
- Full-Stack Monitoring: $58/month per 8GiB host
- Kubernetes Platform Monitoring: $1.40/month per pod
- Log Analytics (pay-per-query): $0.20/GiB ingest
- Custom enterprise pricing available
Pros
- Davis AI delivers deterministic, topology-aware root-cause analysis
- OneAgent auto-discovers services, pods, and hosts without manual configuration
- Grail data lakehouse unifies all observability signals
- Strong compliance and enterprise support options
- Handles complex hybrid and legacy environments better than most Grafana alternatives
Cons
- OneAgent creates deep vendor lock-in
- Proprietary DQL query language
- Per-host and per-pod pricing becomes expensive at Kubernetes scale
- Limited flexibility for teams committed to open standards
- Not a practical option for self-hosted or BYOC-only requirements
6. OpenObserve
OpenObserve is an open-source Grafana alternative that competes directly on storage cost. It uses columnar storage with aggressive compression on S3-compatible backends to deliver what it claims is up to 140x lower storage cost compared to Elasticsearch. For teams where log volume is high and storage cost is the primary concern, OpenObserve is among the most economical Grafana alternatives available.
Best for: Cost-conscious teams running high-volume log and trace ingestion who want unified observability without Elasticsearch's operational overhead or Grafana Cloud's per-GB pricing.
Pricing
- Self-hosted open source: Free
- Enterprise self-hosted: Free up to 200GB/day ingest, advanced features included
- Cloud pay-as-you-go: $0.50/GB ingestion, $0.01/GB queries, $0.20/GB pipeline processing
- Enterprise cloud: Custom pricing with volume discounts
Pros
- Very low storage cost through columnar S3-first architecture
- Full signal coverage including RUM, session replay, and error tracking
- SQL, PromQL, and VRL query support
- Enterprise self-hosted tier free up to 200GB/day
- Fast self-hosted deployment and both cloud and self-hosted options available
Cons
- Smaller community and plugin ecosystem than established alternatives
- Less mature documentation and third-party content
- Cloud pricing at $0.50/GB is higher than some Grafana alternatives at scale
- Fewer enterprise integrations out of the box
7. Elastic (ELK Stack): Grafana Alternative for Search-Heavy Log Workloads
Elastic is one of the most widely used Grafana alternatives for log analytics, and it earns that position on the strength of its indexing model. Where Grafana with Loki struggles with high-cardinality structured log fields because Loki only indexes labels, Elasticsearch indexes every field by default. This makes Elastic the stronger choice for teams that need to filter and aggregate on arbitrary JSON fields within large log volumes without pre-defining schema.
Best for: Teams with complex, structured, or high-cardinality log workloads that require full-field indexing, fast full-text search, and mature tooling for log exploration and analysis at enterprise scale.
Pricing
Elastic offers serverless, hosted cloud, and self-managed deployment options. Serverless Elastic provides consumption-based pricing for Elasticsearch and Elastic Observability workloads. Self-managed is available under open-source and commercial licenses.
Pros
- Full-field log indexing handles high-cardinality structured logs that Loki cannot
- Mature and extensive visualization capabilities in Kibana
- Broad integration ecosystem via Beats, Logstash, and the Elastic Agent
- ES|QL adds SQL-like querying to reduce the Elasticsearch learning curve
- Available as serverless, hosted cloud, or self-managed
Cons
- Self-hosted operational complexity: JVM tuning, shard management, index lifecycle
- Higher storage costs for full indexing versus columnar or object-store Grafana alternatives
- Full observability stack requires configuring multiple components
- Hosted pricing is not transparent without a direct sales conversation
8. VictoriaMetrics
VictoriaMetrics is the strongest Grafana alternative for teams that want to stay in the Prometheus ecosystem but need dramatically better resource efficiency at scale. It started as a drop-in Prometheus replacement and has since expanded with VictoriaLogs for log storage and VictoriaTraces for distributed tracing, making it an increasingly complete stack for teams that want to retain Prometheus tooling while eliminating its operational overhead.
Best for: Platform and SRE teams already invested in the Prometheus ecosystem who want lower resource consumption at scale, and teams that need long-term metric retention without operating Mimir's clustering complexity.
Pricing
- Open source (VictoriaMetrics, VictoriaLogs, VictoriaTraces): Free
- Enterprise: Commercial license with ML anomaly detection, multi-tenancy, and enterprise support (contact sales for pricing)
- VictoriaMetrics Cloud: Managed service, usage-based pricing
Pros
- Dramatically lower resource consumption than Prometheus at scale
- Binary-compatible with Prometheus remote write and PromQL
- VictoriaLogs provides efficient log storage alongside metrics
- VictoriaTraces adds distributed trace storage to complete the signal set
- Excellent documentation and active development
- Open-source single-node is free and production-ready
Cons
- No native visualization layer; requires Grafana or equivalent frontend
- Not a complete Grafana replacement for teams wanting a unified UI
- Cluster mode and advanced features require the Enterprise license
- Smaller commercial ecosystem than full-stack Grafana alternatives
If you need the backend efficiency of VictoriaMetrics but also want a unified query interface and dashboard layer without adding another tool, Parseable covers all three signals with built-in querying and dashboards.
9. Better Stack: Grafana Alternative for Uptime Monitoring and Unified Telemetry
Better Stack is a Grafana alternative that competes on simplicity and price by combining uptime monitoring, incident management, log management, and distributed tracing in a single platform. For teams that currently run separate tools for uptime monitoring and observability, Better Stack collapses both into one tool without requiring a fragmented LGTM-style backend.
Best for: Teams that want to consolidate uptime monitoring and observability into a single Grafana alternative, prefer bundle-based pricing over per-series metric charges, and value OpenTelemetry-native instrumentation with minimal setup.
Pricing
- Free tier: 3GB logs for 3 days, 10 uptime monitors, 1 status page
- Telemetry Nano: $25/month (annual), 40GB each of logs, metrics, traces
- Telemetry Micro: $100/month (annual), 160GB each
- Telemetry Mega: $210/month (annual), 340GB each
- Telemetry Tera: $420/month (annual), 700GB each
- Responder license (on-call and incident management): $29-$34/month
Pros
- Uptime monitoring, incident management, and observability in one platform
- OpenTelemetry-native with SQL, PromQL, and drag-and-drop querying
- eBPF-based agent captures data without code changes for Kubernetes
- Bundle pricing offers cost predictability versus per-series Grafana Cloud pricing
- AI SRE with automated root-cause analysis
- Competitive pricing versus Datadog at comparable data volumes
Cons
- No self-hosted or BYOC option
- Data residency and compliance requirements cannot be met without enterprise negotiation
- Product breadth may not appeal to teams that only want a metrics and logs backend
- Smaller enterprise ecosystem compared to Datadog or Dynatrace
10. Splunk: Grafana Alternative for Enterprise SIEM and Compliance Workloads
Splunk is the Grafana alternative of last resort for most infrastructure and application observability teams -- not because it is weak, but because its cost and complexity are hard to justify unless your workload demands its specific strengths. For organizations where observability and security analytics must share a data platform, Splunk remains a category-defining option backed by more than a decade of enterprise deployments.
Best for: Large enterprises with SIEM requirements, compliance mandates in regulated industries, and security analytics workloads that need to share infrastructure with their observability stack.
Pricing
Splunk does not publish specific rates publicly. Contact Splunk sales for a quote.
Pros
- Most mature enterprise log analytics and SIEM platform available
- SPL handles complex analytical queries across petabyte-scale datasets
- Thousands of app integrations and pre-built security content packs
- Multiple deployment options: cloud, self-hosted, private cloud
- Strong compliance posture for financial services, healthcare, and government
Cons
- Pricing is opaque and very expensive; requires direct sales engagement
- SPL has a steep learning curve for teams not already familiar
- Not competitive on cost for teams whose primary need is observability without security analytics
- Heavy resource requirements for self-hosted deployments
- Modern Grafana alternatives offer better value for observability-only workloads
If your team needs observability without Splunk's enterprise price tag and SIEM complexity, Parseable offers unified logs, metrics, and traces with predictable per-GB pricing and self-hosted or BYOC options.
How to choose the right Grafana alternative
Choosing between Grafana alternatives requires being honest about which dimension of your current stack is causing the most friction today.
If your pain is stack fragmentation and operational overhead, look at Parseable, SigNoz, or OpenObserve. All three are Grafana alternatives that provide unified logs, metrics, and traces without requiring separate backends. Parseable and OpenObserve use object-storage economics to reduce cost at scale. SigNoz uses ClickHouse for fast columnar queries and is fully open-source.
If your pain is cost at scale, Parseable's $0.39/GB all-in Pro pricing, VictoriaMetrics' open-source efficiency, or SigNoz's $0.30/GB consumption model outperform Grafana Cloud's per-metric-series pricing in almost every production scenario. Better Stack's bundle pricing also offers predictability that per-series billing cannot.
If your pain is query complexity during incidents, Parseable's SQL and plain-English querying, New Relic's NRQL with AI assistant, or Better Stack's drag-and-drop query builder reduce friction significantly compared to maintaining PromQL and LogQL alongside each other.
If your pain is data residency or compliance, you need a Grafana alternative with genuine self-hosted or BYOC options. Parseable, SigNoz, Elastic, and VictoriaMetrics all support self-hosted deployments. Parseable's Enterprise BYOC keeps your data inside your own S3 bucket within your VPC. New Relic and Better Stack have no self-hosted option.
If your pain is AI and automation, Parseable's AI-native anomaly detection goes beyond threshold alerting. For teams shipping LLM-based products, Parseable specifically covers AI workload observability across LangChain, OpenAI, Anthropic, and other frameworks alongside infrastructure signals.
FAQ
What is the best Grafana alternative in 2026?
The best Grafana alternative depends on your priorities. For teams that want unified logs, metrics, and traces at lower cost with a simpler operational model, Parseable is the strongest overall choice. For open-source-first teams on a budget, SigNoz offers a free self-hosted tier with a genuinely OpenTelemetry-native architecture. For teams that want a fully managed platform and have budget, Datadog eliminates backend complexity entirely.
What is the best open-source Grafana alternative?
SigNoz and VictoriaMetrics are the strongest open-source Grafana alternatives. SigNoz provides unified logs, metrics, and traces with an OpenTelemetry-native architecture and a free self-hosted community edition. VictoriaMetrics offers the most efficient Prometheus-compatible backend and now includes VictoriaLogs and VictoriaTraces. Parseable also ships an open-source tier with community support and object-store economics.
Which Grafana alternative is best for Kubernetes monitoring?
Parseable, Datadog, and Dynatrace all have strong Kubernetes monitoring stories. Parseable's OpenTelemetry-native ingestion captures logs, metrics, and traces from Kubernetes workloads without separate backends, with object-store economics that scale better than Grafana Cloud's per-metric-series pricing. Datadog offers the richest out-of-the-box Kubernetes dashboards. Dynatrace's OneAgent provides automatic topology discovery for complex Kubernetes environments.
Is there a self-hosted Grafana alternative?
Yes. Parseable, SigNoz, OpenObserve, Elastic, VictoriaMetrics, and Splunk all support self-hosted deployments. Parseable and SigNoz also offer BYOC options where the platform runs inside your own cloud account. For true data ownership where no telemetry leaves your infrastructure, Parseable's Enterprise BYOC plan keeps all data inside your own S3 bucket.
Can I replace Grafana with a single platform?
Yes. Parseable, SigNoz, Datadog, New Relic, Dynatrace, OpenObserve, Better Stack, and Splunk all provide a unified interface covering logs, metrics, and traces. VictoriaMetrics covers metrics and logs but requires a separate visualization layer. The cleanest single-platform Grafana alternatives are Parseable, SigNoz, Datadog, and New Relic.
What is the cheapest Grafana alternative?
For self-hosted deployments, SigNoz, OpenObserve, and VictoriaMetrics are all free on their open-source tiers. For managed cloud, Parseable's Pro tier at $0.39/GB and SigNoz's Teams tier at $0.30/GB for logs and traces are among the most cost-efficient Grafana alternatives, especially compared to Grafana Cloud's $6.50 per thousand active metric series plus $0.50/GB for logs.
Does Parseable support Grafana dashboards?
Yes. Parseable integrates with Grafana as a visualization layer, so teams can continue using existing Grafana dashboards while migrating their backends to Parseable. Parseable also ships its own built-in SQL editor, dashboards, and alerting, making Grafana optional rather than required.
Conclusion
Grafana remains a capable visualization layer, but the multi-backend LGTM stack it depends on carries real costs: operational overhead across four separate systems, incident response slowed by multi-dialect querying, and pricing that scales unpredictably with metric cardinality. The Grafana alternatives in this guide each address a different part of that problem.
For most engineering teams in 2026, the strongest Grafana alternative is one that unifies logs, metrics, and traces without requiring separate backends, queries data through an accessible interface, and scales at a cost that does not require a separate procurement conversation every time your Kubernetes cluster grows. Parseable hits all three of those marks with its $0.39/GB Pro plan, SQL and plain-English querying, object-store economics, and genuine BYOC flexibility.
For open-source-first teams, SigNoz delivers an OpenTelemetry-native unified stack at no cost to self-host. For teams with complex hybrid environments and AI-driven automation requirements, Dynatrace's Davis engine is difficult to match. For organizations where observability and security analytics must share a platform, Splunk remains the category standard.
Whatever is driving your search for Grafana alternatives, the tools in this guide cover the full range of use cases, budgets, and deployment models. Start with the pain point that is costing you the most today, match it against the "how to choose" section above, and trial the two or three Grafana alternatives that fit most closely.
Get started with Parseable and see how it compares against your current Grafana stack.